
Page 91 - 2019_07 resto del Mondo-web
P. 91
LEF-1 regulates β-catenin nuclear localization
ative nuclear-localized (as a proportion of total) β-catenin protein and relative nuclear-localized (as a proportion of total) LEF-1 protein (Figure 5B and C). Interestingly, the overall frequency of β-catenin protein overexpression (approx. 80%) observed in this largely pediatric AML cohort was higher than previous reports (Online Supplementary Figure S6). Taken together, these data indi- cate that nuclear β-catenin translocation capacity is linked to LEF-1 expression in myeloid cell lines, and nuclear LEF- 1 is a strong clinical predictor of nuclear β-catenin levels in patient-derived AML blasts.
Modulation of LEF-1 expression in myeloid cells regulates nuclear-localization of β-catenin and alters Wnt-responsiveness
The above data indicated a correlative relationship between nuclear LEF-1 level and capacity for nuclear β- catenin localization. To demonstrate causation, we exam- ined the effect of modulating LEF-1 expression on β-catenin localization. Initially, we tested multiple LEF1 shRNA sequences (Online Supplementary Figure S7A) and selected the best (TRCN0000428355) for knockdown of nuclear LEF-1 expression in the Wnt-responsive K562 and
A
B
Tandem Mass Tag (TMT) peptide labeling (8 isobaric mass tags) Combine all fractions, fractionate, clean-up, mass spectrometry analysis
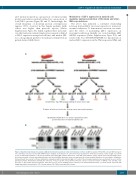
Quantitative identification of β-catenin cytoplasmic/nuclear protein interactions in myeloid leukemia cells
Figure 2. Experimental strategy for analysis of β-catenin interaction partners in myeloid leukemia cell lines. (A) Wnt-responsive K562/HEL cells and Wnt-unrespon- sive cells ML-1 cells were treated with CHIR99021 to stabilize β-catenin prior to cytosolic/nuclear fractionation. From these fractions, either an IgG or β-catenin (β-cat) co-immunoprecipitation (co-IP) was performed generating eight samples which were each TMT labeled with a unique isobaric mass tag. All samples were pooled, fractionated, cleaned and analyzed by mass spectrometry. Mass intensities from each tag report the relative peptide abundance in each sample. Quantitative fold-enrichment of β-catenin co-IP was obtained by comparison with fraction-matched IgG co-IP control. Three biological replicates were performed on each cell line. (B) Representative immunoblots showing the efficiency of total β-catenin co-IP performed from the cytosol or nuclear fractions of SW620 cells and HEL cells. Detection of the known interaction partner TCF-4 was used to assess binding partner efficiency. ID: immunodepleted lysate. β-catenin arrows represent full- length/degradation intermediates; TCF-4 arrows indicate 58/79kDa transcriptional isoforms.
haematologica | 2019; 104(7)
1369
