
Page 71 - 2019_07 resto del Mondo-web
P. 71
Mechanisms of NCOA4-maintained murine erythropoiesis
increase in splenic erythropoiesis (Online Supplementary Figure S3G), confirming a differential activation of stress erythropoiesis in these mice. We also noted an increase in Cd68+ macrophages in Ncoa4fl/fl;EpoR-Cre mice (Figure 5F), suggesting liver macrophages are present in these mice for recycling damaged RBC but also to contribute to stress erythropoiesis.37–39 However, there were no apparent dif- ferences in liver hepcidin expression (Online Supplementary Figure S3H). To evaluate RBC lysis, we analyzed haptoglo- bin and hemopexin levels. Here, we observed a trend towards decreased hemopexin in Ncoa4fl/fl;EpoR-Cre mice which could suggest higher RBC fragility after PHZ administration (Online Supplementary Figure S3I).
Next, we performed a time-course experiment to under- stand the kinetics of recovery from PHZ-induced anemia (Figure 5G). Similarly to the Ncoa4fl/fl;UBC-cre/ERT2 model, Ncoa4fl/fl;EpoR-Cre mice reached a lower hematocrit nadir (Figure 5G). However, within the time course of the exper- iment, Ncoa4fl/fl;EpoR-Cre mice recovered the same hemat- ocrit levels as EpoR-Cre mice (Figure 5G), suggesting retic- ulocytosis is not impaired in this model. This is in contrast to the systemic KO mice in which recovery was incom- plete in the same time period suggesting that non-ery- throid loss of Ncoa4 impairs recovery, likely through dis- rupting systemic iron metabolism. At the endpoint of the time-course experiment (day 11 after PHZ), spleen size
A
FG
BCDE
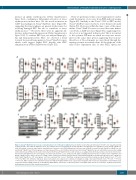
Figure 4. Ncoa4fl/fl;EpoR-Cre mice reveal a cell autonomous role of Ncoa4 in erythropoiesis. A murine model of Ncoa4 deficiency in Ter119+ cells was generated by crossing Ncoa4fl/fl mice with the EpoR-Cre allele. (A) Complete blood count profiling of Ncoa4fl/fl;EpoR-Cre and EpoR-Cre mice [EpoR-Cre, n=19; Ncoa4fl/fl;EpoR-Cre, n=21 mice/group, error bars represent the standard error of mean (s.e.m.)]. (B) Erythropoietin levels in serum of EpoR-Cre versus Ncoa4fl/fl;EpoR-Cre. (EpoR-Cre, n=9 and Ncoa4 fl/fl;EpoR-Cre n=13 mice/group, error bars represent the s.e.m.) (C) Hif-2a protein levels from Ncoa4fl/fl;EpoR-Cre mice. β-actin (Actb) served as the loading control. (D) Increased Fth1 protein levels in bone marrow from Ncoa4fl/fl;EpoR-Cre mice. Actb served as a loading control. (E) Increased tissue iron levels in bone mar- row from Ncoa4fl/fl;EpoR-Cre mice (n=6/group, error bars represent the s.e.m.). (F) Bach1, Hri, Eif2a and Eif2a-P protein levels in red blood cells of EpoR-Cre and Ncoa4fl/fl;EpoR-Cre mice. Actb served as a loading control. (G) Day 10 postnatal complete blood count profiling in EpoR-Cre and Ncoa4fl/fl;EpoR-Cre mice. (EpoR-Cre, n=8; Ncoa4fl/fl;EpoR-Cre, n=5 mice/group, error bars represent the s.e.m.). Statistical comparison was performed using one-tailed Student t-test: *P<0.05, **P<0.01. When not otherwise indicated, data in all panels were subjected to statistical comparison using a two-tailed Student t-test: *P<0.05, **P<0.01, ***P<0.001. RBC: red blood cell count; HCT: hematocrit; HGB: hemoglobin; MCH: mean corpuscular hemoglobin; CHr: reticulocyte hemoglobin content; MCV: mean corpuscular volume; RDW: red blood cell distribution width; RETIC: reticulocyte count; PLT: platelet count; WBC: white blood cell count. Epo: erythropoietin; Hif-2a: heat-inducible factor-2a; Fth1: ferritin heavy chain 1.
haematologica | 2019; 104(7)
1349
