
Page 72 - 2019_07 resto del Mondo-web
P. 72
N. Santana-Codina et al.
ABCD
EFHIJ
G
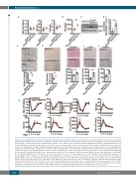
Figure 5. Stress erythropoiesis increases iron retention and macrophages in Ncoa4fl/fl;EpoR-Cre mice. EpoR-Cre and Ncoa4fl/fl;EpoR-Cre animals were treated with phenylhydrazine (PHZ) to induce red blood cell (RBC) lysis. (A) RBC count, hematocrit, and hemoglobin in Ncoa4fl/fl;EpoR-Cre and EpoR-Cre mice after PHZ treatment [4 mice/group, error bars represent the standard error of mean (s.e.m.)]. Data are also presented in Online Supplementary Table S7. (B) Erythropoietin levels in serum of EpoR-Cre and Ncoa4fl/fl;EpoR-Cre mice (n=7/group, error bars represent the s.e.m.) (C) Hif-2a protein levels from Ncoa4fl/fl;EpoR-Cre mice. β-actin (Actb) served as a loading control. (D) Hif-2α mRNA fold-change for EpoR-Cre versus Ncoa4fl/fl;EpoR-Cre mice. (n=3/group, error bars represent the s.e.m.). (E) Erythroblastic islands associated with Cd68 staining in liver of EpoR-Cre and Ncoa4fl/fl;EpoR-Cre mice. (Top) Representative field (40x, scale=50 μm) of five quantified fields per animal (3 mice per group). (Bottom) Quantification of the number of erythroblastic islands (3 mice/group, error bars represent the s.e.m.). (F) Elevated Cd68 staining in liver of EpoR-Cre and Ncoa4fl/fl;EpoR-Cre mice. Representative field (20x) of 3 mice/group (scale bar=200 μm) Bottom: Relative Cd68 expression of CD68 EpoR- Cre and Ncoa4fl/fl;EpoR-Cre mice (n=3/group, error bars represent the s.e.m.). (G) Serial complete blood count profiling of PHZ-administered EpoR-Cre and Ncoa4fl/fl;EpoR-Cre mice. (EpoR-Cre, 5 mice/group, Ncoa4fl/fl;EpoR-Cre, 4 mice/group, error bars represent the s.e.m.). (H-J) Increase in tissue iron staining in Ncoa4fl/fl;EpoR-Cre mice as determined by Prussian blue staining of spleen (H), liver (I) and kidney (J) (representative fields of 3 mice/group, 10x, scale bar=200 μm). (Bottom) Tissue iron levels in spleen, liver, and kidney (3 mice/group, error bars represent the s.e.m.). For all panels, statistical comparison was performed using a two-tailed Student t-test: *P<0.05, **P<0.01, ***P<0.001, except for panel G (hematocrit, day 2), where a one-tailed Student t-test was performed: *P<0.05. RBC: red blood cell count; HCT: hematocrit; HGB: hemoglobin; EPO: erythropoietin; Hif-2a: heat-inducible factor-2A; MCH: mean corpuscular hemoglobin; CHr: reticulocyte hemoglobin content; MCV: mean corpuscular volume; RDW: red blood cell distribution width; PLT: platelet count; WBC: white blood cell count.
1350
haematologica | 2019; 104(7)
