
Page 211 - 2019_07 resto del Mondo-web
P. 211
Gradient-dependent inhibition of GPCR
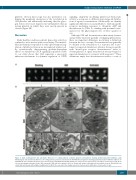
platelets, electron microscopy was also performed, con- firming the peripheral orientation of the cytoskeleton in GDI-platelets and additionally indicating that the glyco- gen bodies were more dispersed in GDI-platelets than in resting platelets in which they were mostly present in clusters (Figure 5B).
Discussion
Under healthy conditions, platelet hemostatic activity is confined to areas near an acute vessel injury. The intracel- lular mechanisms responsible for this spatiotemporal reg- ulation of platelet activation are incompletely understood. By systematically characterizing gradient-dependent effects on stimulatory GPCR signaling in platelets (Table 1), our study shows that GDI represents a previously unknown mechanism for dynamic regulation of GPCR
A
B
signaling, adaptively modifying platelet pro-hemostatic activity as a response to different spatiotemporal distribu- tions of agonist concentrations. Additionally, we identify significant differences in susceptibility to GDI among the receptors mediating responses to thrombin, ADP and thromboxane A2 (Table 1), a finding with potential conse- quences for the physiological roles of these agonists in vivo.
Although GDI and desensitization share many features and probably represent partially overlapping phenomena, there are important differences motivating a distinction between the two concepts. Desensitization can generally be defined as the attenuation of a response due to pro- longed or repeated stimulation, whereas the more specific term “homologous receptor desensitization” refers to downregulation of signal transduction after prolonged or repeated stimulation of a receptor with an agonist.25 These definitions imply that desensitization induces a state of
Figure 5. Actin rearrangement and subcellular differences in resting platelets, activated platelets and platelets showing gradient-dependent inhibition. (A,B) Morphological and cytoskeletal differences in resting platelets, platelets activated by 30 μM PAR1-AP, and platelets showing gradient dependent inhibition (GDI) for 30 μM PAR1-AP were visualized by fluorescence microscopy (A) using AF546-Phalloidin staining of F-actin (scale bar represents 3 μm) and by electron microscopy (B). In electron micrographs, glycogen bodies (GB), a-granules (AG) and dense granules (DG) are shown with arrows and peripheral microtubular loops in GDI-platelets are shown with arrowheads, with a higher magnification in GDI-II. The scale bar in the images represents 1 μm except in GDI-II where it represents 0.5 μm.
haematologica | 2019; 104(7)
1489
