
Page 197 - 2019_07 resto del Mondo-web
P. 197
Abnormal proplatelet formation in PT-VWD
gated anti-GPIX mAb. For details see the Online Supplementary Appendix.
von Willebrand factor-bound circulating platelets
Blood smears were prepared from five different samples of EDTA-anticoagulated human or mouse blood from cardiac punc- ture and analyzed by fluorescence microscopy, as previously described.21,22 For details see the Online Supplementary Appendix.
Statistical analysis
Data are presented as means±Standard Error of Mean (SEM). The t-test for unpaired data was used to analyze results. P<0.05 was considered statistically significant.
A
Results
Platelet-type von Willebrand disease patient
The characteristics of the PT-vWD patient carrying the Met239Val variant in this study have been reported previ- ously.20 Platelet count was mildly and variably reduced (41-168x109/L) and platelet volume mildly increased (13.5 fL, normal: 8.0-12.0 fL), with 94% normal, 5% large, and 1% giant platelets (normal: 95-100%; 0-4% and 0-1%, respectively).29 Similar to the platelet count, the percent- age of reticulated platelets was highly heterogeneous, ranging from 5.7% to 23.6% (normal values 7-10%). The lowest platelet counts (41 and 80x109/L) and the highest
B
C
megakaryocytes.
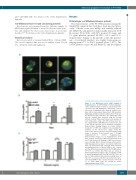
Figure 1. von Willebrand factor (vWF) binding to megakaryocytes. (A) vWF binding to human megakary- ocytes at different days of culture as assessed by confo- cal microscopy. vWF binding was analyzed by confocal microscopy of megakaryocytes cytospun on glass cover- slips. vWF is stained green (Alexa Fluor® 488 Goat Anti- Rabbit IgG), CD42b is stained red (Alexa Fluor® 568 don- key Anti-mouse IgG), and nuclei are stained blue with Hoechst. Samples were mounted using the ProLong Antifade medium (Molecular Probes) and analyzed at room temperature using a TCS SPII confocal laser sys- tem equipped with a DM IRBE inverted microscope and a 40x OIL NA objective (Leica, Bensheim, Germany). Representative merging images are shown. Surface localization of vWF was established by analyzing the intensity of the fluorescence signal along the x-axis on the optical section for each fluorochrome using Image J software. Scale bars=20 μm. P: PT-vWD
megakaryocytes; C: control
Representative images are of megakaryocytes from three controls and of three different preparations from the PT-vWD patient. (B) Binding of vWF (mean fluores- cence intensity, MFI) to human resting control and PT- vWD megakaryocytes at days 7, 10 and 14 of differenti- ation, as assessed by flow cytometry. Data represent mean±Standard Error of Mean (SEM) of five controls and five different preparations from the PT-vWD patient (*P<0.05 vs. control). Raw FACS data are shown in Online Supplementary Figure S11A. (C) Binding of vWF to murine megakaryocytes from TgWT and TgG233V mice at day 4 of differentiation induced by increasing doses of ristocetin, as assessed by flow cytometry. Data repre- sent mean±SEM for five repeated measures (*P<0.05 vs. 0). Raw FACS data are shown in Online Supplementary Figure S11B.
haematologica | 2019; 104(7)
1475
