
Page 157 - 2019_07 resto del Mondo-web
P. 157
BCL2 limits crizotinib efficiency in ALk+ ALCL
variations in the levels of all of these isoforms when com- paring crizotinib-treated siCTL- to siBCL2-transfected cells (data not shown). We then demonstrated that increased BCL2 levels limit the cytotoxic effects of crizo- tinib. To do so, we used two molecular approaches to tar- get BCL2: i) a specific BCL2 siRNA; and ii) miR-34a mim- ics, which have been reported to reduce cell viability and induce apoptosis through efficient BCL2 downregula- tion.41,42 We found that miR-34a mimics potentiated crizo- tinib cytotoxicity more efficiently than siBCL2, an effect
that could be attributed to the versatile role of miR-34a in regulating the expression of myriads of targets that include not only proteins involved in apoptosis, such as BCL2, but also proteins controlling cell cycle and other processes that are necessary for cell viability.26,28 The broad anti-oncogenic activity of miR-34a is nowadays consid- ered to be a clear advantage for the treatment of multi- genic diseases such as cancer and justifies the development of miR-34a mimics delivery- based strategies to combat cancer cells.27,43,44 MRX34, a
A
B
C
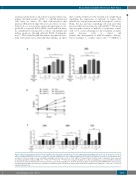
Figure 5. Enhanced autophagic flux induced by rapamycin and crizotinib co-treatment is associated with impaired viability but does not rely on an increase in apop- totic cell death. KARPAS-299 cells were co-treated or not with crizotinib (125 or 500 nM) and rapamycin (100 nM) for 24, 48 and 72 hours (h). (A) Histogram repre- sentation of the percentage of cells with high autophagic flux after 24 h (left) or 48 h (right) of treatment with crizotinib and/or rapamycin. Data represent mean±Standard Error of Mean (SEM); n=5. **P≤0.01; ***P≤0.001; ****P≤0.0001, unpaired Student t-test. (B) Cell viability was assessed by MTS colorimetric measurements after 24, 48 and 72 h of treatment. Data represent mean±SEM; n=3. (C) Flow cytometry analysis of annexin V-positive KARPAS-299 cells treated as described above. Graphs represent the percentage of annexin V-positive cells from five independent experiments ± SEM. ns: not significant; **P≤0.01; ***P≤0.001; unpaired Student t-test.
haematologica | 2019; 104(7)
1435
