
Page 153 - 2019_07 resto del Mondo-web
P. 153
BCL2 limits crizotinib efficiency in ALk+ ALCL
1 light chain 3), an early marker of autophagosomes, cou- pled to both RFP and EGFP (Online Supplementary Methods and Online Supplementary Figure S6). The expression of this tandem fluorescently-tagged LC3 reporter protein enabled flow cytometric quantification and confocal microscopy- based analysis of autophagic flux. In accordance with our previous study,30 we observed that crizotinib induced autophagic flux in a dose-dependent manner, as revealed by an increase in the percentage of cells that exhibited high RFP/EGFP fluorescence ratios (Figure 3A). More importantly, and in keeping with the known function of BCL2 in autophagy downregulation,19-22 we found that BCL2 knockdown, using either siBCL2 (Figure 3A and B) or miR-34a mimics (Figure 3A and C), strongly increased the percentage of cells with high RFP/EGFP ratios, indica- tive of a higher autophagic flux, which was observed both in basal and crizotinib-treatment conditions. We con- firmed these results by performing two other assays to monitor and quantify autophagic flux in the KARPAS-299
whole cell population (Online Supplementary Figures S7- S9), and in two other ALK-positive ALCL cell lines (Online Supplementary Figure S10). Altogether our results strongly indicate that BCL2 plays a key role in restraining both the basal- and crizotinib-induced autophagic flux in ALK-positive ALCL.
Enhanced autophagic flux induced by BCL2 downregulation and crizotinib treatment is associated with impaired cell viability
To elucidate whether this substantial increase in autophagic flux upon combined crizotinib treatment and BCL2 downregulation could be involved in the increased loss of cell viability observed under the same conditions, we followed the survival of cells in which the autophagic machinery was impaired through the knockdown of ULK1, a key factor involved in the very early stages of the autophagy process.34 mRFP-EGFP-LC3 KARPAS-299 cells were transfected with siRNA directed against ULK1
A
B
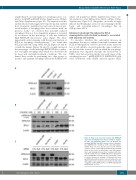
Figure 1. BCL2 levels inversely correlate with NPM-ALK
expression and ALK tyrosine kinase activity in anaplas- C tic large cell lymphoma (ALCL) cells. (A) Western blot showing NPM-ALK and BCL2 protein levels in ALK-posi- tive (KARPAS-299, SU-DHL-1, COST) and ALK-negative (FE-PD) ALCL cell lines. β-actin served as the internal control to ensure equal loading. (B) Western blot showing BCL2 protein levels in ALK-positive and ALK-negative ALCL cells following 24 hours (h) of treatment with crizo- tinib (500 nM). The loss of NPM-ALK tyrosine phosphory- lation (P-NPM-ALK, Y1604) served as an internal control to ensure efficiency of crizotinib. (C) Western blot show- ing NPM-ALK and BCL2 protein levels in ALK-positive and ALK-negative ALCL cells that were transfected with either a negative control siRNA (siCTL) or a siRNA targeting ALK
mRNA (siALK) for 72 h.
haematologica | 2019; 104(7)
1431
