
Page 114 - 2019_07 resto del Mondo-web
P. 114
J. Baeten et al.
tion and processing, and oxidative phosphorylation (Online Supplementary Table S7), suggesting that the SP includes an increased number of quiescent cells, another trait characteristic of stem cells.39,40 We validated expres- sion of several stem cell genes and a panel of Wnt path- way genes by qPCR in four tumors sorted for SP and non- SP, which showed a significant increase in all but one of the tested genes (Figure 5B). Overall, the results described in this study demonstrate that the SP assay greatly enrich-
Table 1. Limiting-dilution analysis of sorted side population cells.
es for LPC in zebrafish ALL and provides more evidence for the importance of the Wnt signaling pathway in LSC.
Discussion
Although the importance of CSC to tumor mainte- nance, resistance, and relapse has long been proposed,41 the challenge of isolating and targeting these cells has been
Cells
Unsorted, unstained
Side population
Non-side population
Cell dose
1000 100 10
1000 100 10
1000 100 10
Engraftment
9/11 18/24 34/35
10/10 16/17 18/28
8/9 15/17 4/26
LPC frequency [LPC%] (95% confidence interval)
1/66.5 [1.5%] (0.97% – 2.3%)
1/15 [6.5%]
(3.8% – 11%) 1/109.3 [0.91%]
(0.52% – 1.6%)
P<3.76 x 10⁻⁷
P<2.78 x 10⁻⁹
Representative table (Tumor 2 in Figure 2B) showing limiting-dilution analysis of sorted side population cells transplanted into syngeneic recipients compared to unsorted and non-side population. Seventy-five fish per group were transplanted for a total of 225 fish: 1000 cell dose = 15 fish, 100 cell dose = 25 fish, 10 cell dose = 35 fish. Recipient fish that died before the median engraftment date were excluded from the total. Mean leukemia-propagating cell (LPC) frequencies, 95% confidence intervals, and pairwise P-values determined by Extreme Limiting Dilution Analysis software.
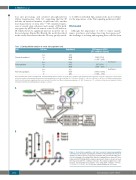
A
B
Figure 3. Sorted side population cells have increased leukemia-propagating cell frequency. (A) Graphic depicting the workflow of determining leukemia-prop- agating cell (LPC) frequency in the side population (SP) and non-SP. FACS: fluo- rescent activating cell sorting; ELDA: Extreme Limiting Dilution Assay. (B) Three independent SP limiting-dilution analysis experiments. Data are shown as mean LPC frequency with 95% confidence intervals. The statistical significance of dif- ferences was determined by pairwise tests using ELDA software: **P<10-5, ***P<10-8, ****P<10-11 (n = 60 fish per experimental group, 360 total).
1392
haematologica | 2019; 104(7)
