
Page 112 - 2019_07 resto del Mondo-web
P. 112
J. Baeten et al.
Results
The frequency of side population cells correlates with leukemia-propagating cell frequency in zebrafish acute lymphoblastic leukemia
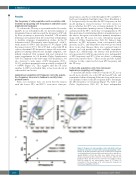
To evaluate the SP assay as a potential method for study- ing LPC in our zebrafish model, we harvested primary or transplanted tumors and measured the frequency of SP cells by flow cytometry as previously described.28 All zebrafish leukemias were generated in the clonal CG2 zebrafish line to facilitate syngeneic transplantation studies. In the 57 leukemias tested, SP frequency varied between 0 – 64.6%, with a mean of 14.84% and a median of 7.8% (Figure 1). Of the tumors tested, 87.7% (50 of 57) had a detectable SP. In order to determine LPC frequencies, tumor cells were trans- planted at limiting dilutions into multiple syngeneic, sub- lethally irradiated CG2 recipient fish and evaluated for tumor engraftment for 2-4 months (Online Supplementary Table S1). Similarly to the wide range of SP frequencies, we also observed a wide range of LPC frequencies (0.09 – 13.4%), and these parameters were positively correlated (R2 = 0.6898) (Figure 1C). This suggests that the SP assay enriches for LPC in zebrafish ALL, as has been shown in other models and tissues.
Leukemia-propagating cell frequency and side popula- tion frequency increase in tandem in serially trans- planted tumors
From our correlative data, we noted that the tumors with the lowest SP% and LPC% were most often pri-
AB
mary tumors, and those with the highest SP% and LPC% had been transplanted multiple times. Since Blackburn et al. had previously shown that the LPC frequency in this model undergoes clonal evolution,33 we were curious to know whether the SP% was evolving similarly. To test this, we transplanted primary tumors at limiting dilution, and measured the SP% on the day of transplantation. We then performed serial limiting-dilution transplantation of the tumors that grew out from these primary transplants, along with the SP assay for each subsequent passage (Figure 2) (Online Supplementary Table S2). Indeed, large increases in LPC frequency often corresponded with increases in SP%, and when these data were pooled with those from other lineages there was a general trend of increase in both parameters after multiple transplants (Figure 2C). Additionally, the latency and proliferation rate (measured by EdU incorporation) were independent of LPC frequency and SP% (data not shown), confirming previously reported data.33 These results provide further evidence for the connection between LPC frequency and the SP assay.
Sorted side population cells have increased leukemia-propagating cell frequency
To measure the ability of the SP to enrich for LPC in our model more directly, we sorted SP and non-SP cells and transplanted them at limiting dilutions along with unsort- ed, unstained control cells into recipient fish to determine the LPC frequency of each group (Figure 3A, Table 1 and Online Supplementary Table S3). In three independent
C
Figure 1. Frequency of side population cells in zebrafish acute lym- phoblastic leukemia correlates with leukemia-propagating cell fre- quency. (A, B) Side population (SP) assay performed on a zebrafish acute lymphoblastic leukemia (ALL) tumor without (A) or with (B) ver- apamil inhibitor to block dye efflux. Live, singlet, tumor cells are shown separated by their emission of Hoechst blue (450/50 nm bandpass filter) and Hoechst red (670/30 nm bandpass filter). Data are shown for one representative tumor of 57 tested. (C) Correlation of the percentage of SP cells versus the frequency of leukemia-propagating cells (LPC).
1390
haematologica | 2019; 104(7)
