
Page 182 - 2019_04-Haematologica-web
P. 182
P.P. Kulkarni et al.
A
B
C
D
E
F
GH
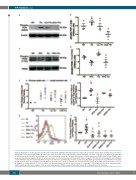
Figure 2. Regulation of aerobic glycolysis and the pentose phosphate pathway in stimulated platelets. (A and C) Representative immunoblots showing expression of phos- pho-PDH (Ser 293) and phospho-PKM2 (Tyr 105), respectively, in platelets treated with different reagents (thrombin, 0.5 U/mL; compound C, 50 mM; DCA, 20 mM; PP2, 50 mM) as indicated. (B and D) Corresponding scatter dot plots showing expression of phospho-PDH relative to β-actin and phospho-PKM2 relative to total PKM2, respec- tively, after densitometry analysis. (E) Glucose uptake and lactate secretion rates in platelets treated with different reagents. (F) Scatter dot plot showing the ratio of NADPH to total NADP(H) in platelets treated with different reagents as indicated. (G and H) ROS generation as detected by H2DCFDA dye in platelets treated with different reagents as indicated. The dose of apocynin was 600 mM. Data are presented as the mean ± standard error of mean. Each dot represents an independent observation. (*P<0.05 as compared to resting platelets; #P<0.05 as compared to thrombin-stimulated platelets). Apo: apocynin; CC, compound C; DCA: dichloroacetate; DASA: diarylsulfonamide; DHEA: dehydroepiandrosterone sulphate; PDH: pyruvate dehydrogenase; PKM2: pyruvate kinase splice variant; RP: resting platelets; Thr: thrombin.
810
haematologica | 2019; 104(4)
