
Page 181 - 2019_04-Haematologica-web
P. 181
Aerobic glycolysis fuels platelet activation
A
BC
DE
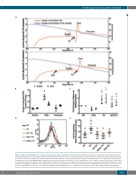
Figure 1. Platelets exhibit higher rate of aerobic glycolysis upon agonist stimulation. (A) Polarograms exhibiting oxygen flow or oxygen concentration in thrombin (0.5 U/mL)-stimulated platelets suspended in Tyrode modified buffer. The platelets were not pretreated (upper panel) or were pretreated with DCA (20 mM) (lower panel). The blue line represents oxygen concentration within the chamber while the red line traces the rate of oxygen consumption by the cells. (B) Scatter dot plots repre- senting routine, peak (following thrombin addition) and post-peak respiration in platelets. (C) Fold change in the rate of glucose uptake (black circles) and lactate secretion (blue squares) in platelets treated with different reagents as indicated. (D and E) GLUT3 externalization as observed by flow cytometry in platelets treated with different reagents as indicated. Data are presented as the mean ± standard error of mean. Each dot represents an independent observation. (*P<0.05 as com- pared to resting platelets; #P<0.05 as compared to thrombin-stimulated platelets). CC, compound C; DCA: dichloroacetate; RP: resting platelets; Thr: thrombin.
haematologica | 2019; 104(4)
809
