
Page 144 - 2019_04-Haematologica-web
P. 144
R. Burkhard et al.
ABC
D
E
F
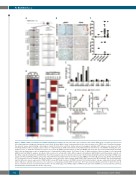
Figure 5. TIRAP p.R81C a potential novel familial lymphoma risk variant. (A) (Top) Schematic representation of the human TIRAP gene locus with open and closed boxes indicating non-coding and coding exons, respectively. (Bottom) Whole exome sequencing data for the affected region of the TIRAP exon 5 visualized in integra- tive genomic viewer demonstrating a heterozygous variant in both sisters and their mother, whereas homozygous wild-type (WT) sequence was observed in the remaining family members. Sanger sequence data of complementary (c) DNA isolated from fresh peripheral blood mononuclear cells (PBMCs) showing the same variant. Of note, no cDNA was available for sister 1 (deceased). (B) IRAK1 phosphorylation (p) and total IRAK4 expression was assessed by immunohistochemistry (IHC) in the two lymphomas as well as lymphoid tissue of (unmatched) healthy controls. Scale bars: 50 mm. (C) Representation of the percentage of cells expressing pIRAK1 and total IRAK4 in samples described in (B) as well as 36 activated B-cell-like diffuse large B-cell lymphoma (ABC-DLBCLs) and 32 germinal center B-cell- like diffuse large B-cell lymphoma (GCB-DLBCLs). The primary samples have been described previously.50 (D) Heatmap showing hierarchical clustering of mRNA levels of genes involved in NF-κB pathway, cell survival and proliferation in peripheral blood mononuclear cells (PBMCs) of mother (M), sister 2 (S2), brother (B) and father (F). The hierarchical cluster analysis (Euclidean’s method) reveals two major clusters representing TIRAP p.R81C mutated and WT individuals. Bar chart showing the log2 fold difference in gene expression in TIRAP p.R81C versus WT family members. (E) PBMCs isolated from family members and age- and gender-matched healthy donors (HD) were cultured in the presence (+) or absence (-) of lipopolysaccharide (LPS) for 12 hours. Ki-67 was measured by flow cytometry on CD20+ B-cells. (F) Linear correlation (Pearson correlation) between Ki-67+ B-cells and BCL2L1 (left), NFKB1 (right) or TIRAP (below) expression in PBMCs as measured by flow cytometry and quantitative PCR (normalized to ACTb), respectively.
772
haematologica | 2019; 104(4)
