
Page 44 - 2019_02-Haematologica-web
P. 44
X. Wang et al.
ABC
DEFG
HIJ
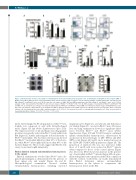
Figure 1. Rheb1 deletion increases the number of hematopoietic stem cell/hematopoietic progenitor cells and immature neutrophils in bone marrow (BM) of Rheb1Δ/Δ mice. Whole BM cells were isolated from BM of tibias, femurs and ilia of 8-week old mice. (A) The absolute number of CD48–CD150+LKS+ population in the BM of Rheb1fl/fl and Rheb1Δ/Δ mice; n=3. (B) The absolute cell number of GMP, CMP and MEP populations in the BM of Rheb1fl/fl and Rheb1Δ/Δ mice, n=3. (C) FACS analysis of LKS+ cells and LKS– in the BM; n=3. (D) Cell cycle status of Rheb1fl/fl or Rheb1Δ/Δ LKS+; n=3. (E) FACS analysis of neutrophils in Rheb1fl/fl and Rheb1Δ/Δ PB and BM, n=3. (F and G) The percentages of neutrophil subpopulations in Rheb1fl/fl and Rheb1Δ/Δ PB and BM; n=3. (H) Representative images of Wright-Giemsa stain- ing of the sorted P1-P3 subpopulations of neutrophils from BM. (I) qRT-PCR analysis for the mRNA expression of granule proteins in neutrophils. Elane: neutrophil elastase; Ltf: lactotransferrin precursor; Mpo: myeloperoxidase; n=3. (J) The E. coli survival rates after co-culturing with neutrophils; n=3. Data are presented as mean±Standard Error of Mean. *P<0.05; **P<0.01; ***P<0.001.
nuclei. Interestingly, the P3 subpopulation of Rheb1Δ/Δ neu- trophils was composed of cells with butterfly-shaped nuclei (Figure 1H and Online Supplementary Figure S2D). The expression levels of Ltf and Elane (encoding granule proteins) were greatly reduced in Rheb1Δ/Δ neutrophils from BM (Figure 1I), further indicating the reduced maturity of Rheb1Δ/Δ neutrophils. The bacterial survival assay showed that Rheb1Δ/Δ neutrophils killed less than 10% of the bacte- ria, while Rheb1fl/fl neutrophils killed more than 60% of the bacteria (Figure 1J). These results suggest that Rheb1 defi- ciency caused neutrophil immaturity.
Rheb1 deletion induced extramedullary hematopoiesis in the spleen Δ/Δ
Physical examinations revealed that Rheb1 mice dis- played splenomegaly as demonstrated by the increase of their spleen size and weight (Figure 2A and B). Histopathological examination showed evident extramedullary hematopoiesis, including clustered
megakaryocytes (Figure 2C, arrowheads) and hematopoi- etic islands (Figure 2C, arrows) in Rheb1Δ/Δ mice. However, liver and lung examination showed no significant differ- ences between Rheb1fl/fl and Rheb1Δ/Δ mice (Online Supplementary Figure S2E and F). FACS analysis confirmed splenic extramedullary hematopoiesis, characterized by an increase in the percentages of LKS+ (HSCs) and LKS– (HPCs) cells (Figure 2D and E) and a marked increase in the CD34+LKS– (GMP/CMPs) populations (Figure 2F). The proportion of myeloid cells was also increased, while those of T and B cells were reduced in Rheb1Δ/Δ spleens when compared to those of the control spleens (Figure 2G). Moreover, FACS showed an increase in the percent- age of neutrophils in Rheb1Δ/Δ spleens (Figure 2H), in agree- ment with granulocytic expansion in the PB in comparison with the controls. Collectively, our results demonstrated that Rheb1 deficiency induces extramedullary hematopoiesis in the spleen to compensate the hematopoiesis defect in the BM.
248
haematologica | 2019; 104(2)
