
Page 173 - 2019_02-Haematologica-web
P. 173
Outcome in MM after allo-SCT
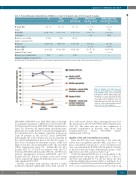
Table 4. Revised-Myeloma Combordity Index (R-MCI) assessment of 46 patients alive at the time point of analysis.
MedianR-MCI
(range)
MedianKPS
[%] (range) Moderate-severe frailty [number of patients] (%) Medianage
[years] (range)
Median eGFR
[ml/min/1.73 m2] (range) Moderate-severe lung function
impairment [number of patients] (%)
ID Prior Current Median change Median change from allo-SCT (last follow up) from ID to current prior allo-SCT to current
PP
4(0-6) 3(0-5) 3(0-7) 0(-5-5) 0(-3-5) 0.766 0.065
80(40-100) 90(60-100) 90(50-100) 10(-30-50) 0(-20-40)
0.008 0.411 15 (33) 9 (20) 14 (30) - -
51(29-63) 53(29-67) 60(33-79) 8(2-20) 6(1-20)
86 (8 -121)
4 (9)
85 (32 - 126)
0 (0)
68 (16 -113)
2 (4)
< 0.001 -11 (-77 - 66) 0.028
-
< 0.001 -14 (-17 - 44) < 0.001
-
ID: initial diagnosis; allo-SCT: allogeneic stem cell transplantation; KPS: Karnofsky Performance Status; eGFR: estimated glomerular filtration rate.
Figure 4. Quality of life (QoL) assessed with the Revised-Myeloma Comorbidity Index (R-MCI). Single factors [Karnofsky Performance Status (KPS), frailty, age, impairment of renal and lung function] are shown at initial diagnosis, the time point right before allogeneic stem cell transplantation (allo-SCT) and at the last follow up. eGFR: estimated glomerular fil- tration rate; ID: initial diagnosis.
2000-2004, 2005-2009 versus 2010-2016. Indeed, the high- est cumulative incidence of NRM was observed after allo- SCT performed between 2000-2004 (Online Supplementary Figure S3). However, the improvement in patients trans- planted more recently did not reach statistical significance, most probably due to the number of patients in the group (only 19 patients in the allo-SCT years 2000-2004). Interestingly, the lowest relapse rate was documented in the earliest transplantation period, but this fact seems to have been overturned by treatment toxicity, as OS was improved in the cohort transplanted after the year 2010 (Online Supplementary Figure S3). Median OS was 20.1 months (95%CI: 7.5-112.5) for patients with allo-SCT between 2000-2004, 25.6 months (95%CI: 14.0-57.6) for patients transplanted between 2005-2009, and 73.7 months (95%CI: 25.2-not reached) in the most recent cohort, respectively. Again, the difference was not statisti- cally significant (P=0.190).
Survival of patients with sufficient response to initial treatment remained significantly better than survival of
those with active disease when adjusting this factor for the time point of allo-SCT (P=0.004) (Online Supplementary Table S4). The same was true for the comparison of patients transplanted in first-line with those with relapsed/refractory disease (P<0.0001) (Online Supplementary Table S4).
Quality of life and comorbidity assessment
Since allo-SCT may cause long-term or late onset side effects that can influence patients' QoL, and due to our prior comorbidity evaluations to assess treatment toler- ance, we performed the R-MCI in the 46 patients still alive at the last follow up at three different time points: at ID, right before allo-SCT, and at last follow up.24
At ID, the median R-MCI was 4, corresponding to the intermediate-fit risk-group; this improved to 3 prior to allo-SCT, and remained at 3 at the last follow up, thus reflecting slightly fitter patients (Table 4 and Figure 4). A comparison of R-MCI assessed at ID and right before allo- SCT to the current R-MCI assessed at the last follow up
haematologica | 2019; 104(2)
377
