
Page 171 - 2019_02-Haematologica-web
P. 171
Outcome in MM after allo-SCT
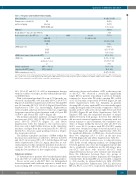
Table 3. Response and treatment-related toxicity. Alive / dead (%)
Primary cause of death (%), PD partly overlapping infection
46 (42) / 63 (58) 49 (45)
19 (17)
GvHD/GvHDonly 7(6)/2(2) 14 (13)
NRM (%)
Death within 100 days after allo-SCT (%)
Best response after allo-SCT (%) CR ORR
42 (39)
8 (7)
77 (70)
vgPR / PR
SD/MR 25(23)/4(4)
PD 3(3) aGvHD grade (%) 0 54 (50)
no / mild moderate / severe n.e.
ANC > 0.5x10⁹/L PLT > 20x109/L
15 (14) / 20 (18)
aGvHD onset (range) [day after allo-SCT] cGvHD (%)
Median engraftment
[day after allo-SCT] (range)
CMV-reactivation yes / no (%)
I/ II 27 (25) / 17 (15) III/IV 9(8)/2(2) 47 (3 - 150)
63 (58) / 13 (12) 18 (17) / 8 (7) 7 (6)
18 (10 - 54) 12 (5 - 48) 51 (47) / 58 (53)
allo SCT: allogeneic stem cell transplantation; PD: progressive disease; GvHD: graft-versus-host disease; NRM: non-relapse mortality; CR: complete remission; ORR: overall response rate; (vg)PR: (very good) partial remission; SD: stable disease; MR: minimal response; PD: progressive disease; aGvHD: acute GvHD; cGvHD: chronic GvHD; n.e.: not evaluated; ANC: absolute neutrophil count; PLT: platelet count; CMV: cytomegalovirus.
32% (15 of 47) and 23% (9 of 39) as maintenance therapy without evidence of relapse, mostly within different clini- cal DSMM trials.
With a substantial median follow up of 71.5 months, we observed a median OS of 39.2 months (95%CI: 23.4-73.7) (Figure 1A and Online Supplementary Table S2). Median PFS was 14.2 months (95%CI: 11.9-20.1) (Figure 1B and Online Supplementary Table S2). Interestingly, Kaplan-Meier curves reached a plateau after about ten years, suggesting long-term survival in selected patients with a 10-year OS of 28.4% and 10-year PFS of 24% (Figure 1B).
The median cumulative incidence of relapse within the first year was 33.6% (95%CI: 25.7-43.9) and 67.6% in ten years (95%CI: 58.6-77.9) (Figure 1C and Online Supplementary Table S3). Similar to the survival curves, there was only a slight further increase in the cumulative incidence of relapse from the second year (51.4%, 95%CI: 42.6-61.9) to ten years, again pointing towards a relapse- free long-term survival.
The median cumulative incidence of NRM within the first year was relatively low with 8.4% (95%CI: 4.5-15.7) and 12.4% in ten years (95%-CI: 7.4-20.6) (Figure 1D and Online Supplementary Table S3). Again, there was no sub- stantial increase in this cumulative incidence from the sec- ond year (11.4%, 95%CI: 6.7-19.4) to ten years, empha- sizing the low incidence of late complications.
Subgroup analyses
To determine those patients who benefited particularly from allo-SCT, we conducted different subgroup analyses. Disease activity prior to allo-SCT. First, we distinguished between patients with sufficient response to initial treat- ment reaching MR or better (inactive disease) and those
with active disease and evidence of PD at the time point of allo-SCT. We observed a statistically significantly longer OS for patients responding to previous therapies compared to those with PD with a median OS of 65.0 versus 11.5 months, respectively (P=0.003) (Figure 2A and Online Supplementary Table S2). Similarly, in patients showing MR or better, median PFS was statistically signif- icantly prolonged with 18.4 months compared to only 5.1 months in those with active disease right before allo-SCT (P=0.001) (Figure 2B and Online Supplementary Table S2). Similar to PFS data, the cumulative incidence of relapse differed between both groups; however, this difference did not reach statistical significance. In patients with suf- ficient response to prior treatment, the cumulative inci- dence of relapse within the first year after allo-SCT was 26.0% versus 53.3% in those with PD (P=0.087); similar results were obtained for longer observation periods (2, 5, 10 years) (Figure 2C and Online Supplementary Table S3). No significant difference in NRM was observed between these two subgroups (13.3 vs. 6.5% in the first year; P=0.332) (Figure 2D and Online Supplementary Table S3).
Allo-SCT as first-line treatment versus in relapsed/refractory MM. In the second subgroup analysis, we distinguished between patients who were allo-transplanted in first-line due to a high-risk constellation, mostly following a prior auto-SCT, and those who received allo-SCT with relapsed/refractory disease after extensive pre-treatment. Here, the differences between these two groups of patients were the most distinct. In patients allo-transplant- ed in first-line, the median OS was not reached, compared to 21.6 months in relapsed/refractory MM (P<0.001) (Figure 3A and Online Supplementary Table S2); the 5-year OS was 50.2% versus 5.4%, respectively. Similarly, the dif-
haematologica | 2019; 104(2)
375
