
Page 172 - 2019_02-Haematologica-web
P. 172
C. Greil et al.
AB
C
D
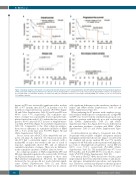
Figure 3. Subgroup analysis of therapeutic concept for patients with allogeneic stem cell transplantation (allo-SCT) within their first-line therapy (tandem approach, n=46) versus those with relapsed/refractory (r/r) disease (n=63). (A) Kaplan-Meier estimates for overall survival (OS). (B) Kaplan-Meier estimates for progression- free survival (PFS). (C) Cumulative incidence of relapse rate (RR). (D) Cumulative incidence of non-relapse mortality (NRM). mo: months; y: year; n.r.: not reached; CI: Confidence Interval.
ference in PFS was statistically significant with a median PFS of 47.7 months after allo-SCT in first-line versus 9.6 months in relapsed/refractory patients (P<0.001) (Figure 3B and Online Supplementary Table S2) and 5-year PFS was 49.8% versus 3.7%, respectively. The cumulative inci- dence of relapse was considerably lower in patients trans- planted in first-line with 11.0% within the first year com- pared to 50.3% after allo-SCT in cases of relapsed/refrac- tory MM (P<0.0001) (Figure 3C and Online Supplementary Table S3). Comparable to the other subgroup analyses, there was no difference in cumulative incidence of NRM (8.8 vs. 8.1% in the first year; P=0.793) (Figure 3D and Online Supplementary Table S3).
Disease activity after allo-SCT, HLA-compatibility and cyto- genetic risk group. As expected, the remission status after allo-SCT had a substantial impact on survival, with a median OS of only a few weeks in the case of a lack of response, significantly shorter PFS, and an enhanced cumulative incidence of relapse. There was no difference in the cumulative incidence of NRM (data not shown).
In a subgroup analysis of HLA-compatibility, PFS and OS were impaired in patients who received allo-SCT from an HLA-non-identical donor compared to those after HLA-identical transplantation. However, the difference between the two groups did not reach statistical signifi- cance (Online Supplementary Table S2 and Online Supplementary Figure S1). Likewise, there was no statisti-
cally significant difference in the cumulative incidence of relapse and NRM (Online Supplementary Table S3 and Online Supplementary Figure S1).
When analyzing the 57 patients with complete cytoge- netic analysis with respect to cytogenetic risk, a longer OS and PFS was observed in the standard risk group in com- parison to patients with high risk, poor risk or ultra-high risk (Online Supplementary Table S2 and Online Supplementary Figure S2). Again, there was no difference in the cumulative incidence of relapse and NRM (Online Supplementary Table S3 and Online Supplementary Figure S2).
A subclassification according to cytogenetic risk of the 20 patients with available complete cytogenetic analysis transplanted in first-line showed no impact on survival. In the standard risk group, median OS was 77.2 months compared to 65.8 months in those patients with high risk, poor risk or ultra-high risk cytogenetics; 5-year OS was 100% versus 73.3%, respectively (P=0.256) (Online Supplementary Table S2). The median PFS was 47.7 versus 68.3 months, and 5-year PFS 43.8% versus 64.2%, respec- tively (P=0.874) (Online Supplementary Table S2).
Time point of allo-SCT. Over the last two decades, great improvements have been achieved in terms of anti-myelo- ma strategies, transplantation procedure, and supportive care. Therefore, survival may depend on the time point of allo-SCT during our long observation period of 17 years:
376
haematologica | 2019; 104(2)
