
Page 95 - 2019_01-Haematologica-web
P. 95
MYB effects on miRNA profile of Ph+ leukemia cells
1C). Since miR-17 and miR-18a belong to the miR-17-92 cluster (Figure 1E) which is involved in BCR-ABL-depen- dent transformation,29 we also assessed levels of cluster members miR-19a-3p,-19b-3p,-20a-5p and miR-92-5p. These miRNAs were among those expressed in both cell lines in our microarray assay (Online Supplementary Tables S3 and S4). In contrast with the microarray data, qRT-PCR analysis showed that levels of all 4 miRNAs were down- regulated in Doxy-treated (48 h) K562-ShMYB cells, whereas only the expression of miR-19a-3p, miR-19b-3p and miR-92-5p (24 h) was decreased in Doxy-treated BV173-ShMYB cells (Figure 1F and G). These conflicting results may depend on the greater sensitivity of the qRT- PCR compared to the microarray assay. We also assessed the effects of MYB silencing on the expression of the miR- 17-92 cluster in the Ph+ ALL cell line SUP-B15 which expresses the p190 BCR-ABL isoform. In this line, Doxy treatment (24 and 48 h) to silence MYB expression induced a statistically significant decrease of miR-17, miR- 18a, miR-19a and miR-19b levels (Online Supplementary Figure S1). Specificity of the effects of MYB silencing on the expression of the miR-17-92 cluster were demonstrat- ed by using a BV173 derivative line expressing a mutant MYB cDNA harboring synonymous point mutations in the sequence targeted by the MYB shRNA (shRNA-resis-
tant MYB BV173 cell line). Upon Doxy treatment to silence endogenous MYB expression, we found that, in contrast to the parental line (BV173-ShMYB), expression of members of miR-17-92 cluster was not modulated in the BV173 line expressing the MYB cDNA not targetable by the MYB ShRNA (Online Supplementary Figure S2). Thus, Doxy-induced changes in the expression of the miR-17-92 cluster are a specific consequence of MYB silencing.
MYB binds the promoter of the miR-17-92 cluster
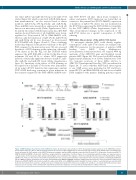
To investigate whether MYB could directly regulate transcription of the miR-17-92 cluster, we analyzed the MIR17HG promoter for the presence of putative MYB binding sites (MBS). Using MatInspector (www.genomatix.de/matinspector.html), we scanned 4000 bp upstream of the MIR17HG gene and identified several putative MBS (Figure 2A). We focused on 5 MBS with the highest matrix similarity score (Online Supplementary Table S5). Genomic positions of these MBSs relative to MIR17HG Transcriptional Start Site (TSS) are indicated in Figure 2A. To assess whether MYB binds these regions in vivo, ChIP assays were performed in NT and Doxy- treated BV173- and K562-ShMYB cells and de-cross-linked DNA amplified with primers flanking genomic regions
A
B
C
Figure 2. MYB binding to the promoter of the miR-17-92 cluster. (A) Schematic representation of 4000 bp regulatory regions upstream of the MIR17HG promoter. A transcription start site (TSS) is indicated. Arrows indicate the promoter region amplified by the specific primer pair used for qPCR amplification of immunoprecip- itated chromatin. (B) ChIP analysis of the MIR17HG promoter using the indicated MYB antibody in untreated (Not Treated; NT) or Doxycycline (Doxy)-treated BV173- ShMYB and K562-ShMYB cells. Results of qPCR are analyzed with the comparative Ct method. Values of each immunoprecipitated sample are expressed as per- centage relative to their respective input and by subtracting the values obtained in the negative controls (no antibody). Error bars represent Standard Error of Mean (SEM) (n=3); P-values (*P≤0.05) were determined using Student t-test. (C) (Left panel) Schematic representation of the reporter plasmids containing the MYB bind- ing site (MBS) #1 (pGL3–prom1353) or its deletion mutant without the MBS#1 (ΔMBS#1-prom230). (Right panel) Dual luciferase assay performed in untreated or Doxy-treated BV173-ShMYB cells transfected with the pGL3–prom1353 or the ΔMBS#1-prom230 plasmid. Promoter activity of each plasmid was determined 48 hours (h) after transfection. Luciferase activity values were normalized for transfection efficiency according to the activity of a co-transfected Renilla luciferase plas- mid. Data are the average of three independent experiments performed in duplicate; error bars indicate Standard Error of Mean (*P≤0.05).
haematologica | 2019; 104(1)
85
