
Page 94 - 2019_01-Haematologica-web
P. 94
M. Spagnuolo et al.
Real-time PCR analysis of differentially expressed miRNAs in doxycycline-treated BV173-, SUP-B15- and K562-ShMYB cells
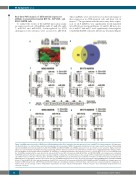
To validate the results of the miRNA microarray analy- sis, expression levels of 5 miRNAs (miR-17, miR-18a, miR- 7, miR-324 and miR-4284) down-regulated by MYB silencing in both cell lines were assessed by qRT-PCR.
These miRNAs were selected based on the fold change of their expression in MYB-silenced cells and their role in tumors.24-28 In agreement with the microarray data, expres- sion of all 5 miRNAs was significantly down-regulated after 48 h Doxy treatment (Figure 1C and D). Of note, lev- els of miR-17 and miR-7 were significantly down-regulat- ed in K562-ShMYB cells after 24 h Doxy treatment (Figure
AB
CD
E
FG
Figure 1. miRNA expression profile of MYB-silenced Philadelphia-positive (Ph+) leukemia cells and expression levels of miR-17-92 cluster members. (A) (Upper pan- els) Western blots of a representative experiment showing specific knockdown of MYB in Doxycycline (Doxy)-treated cells; (lower panel) heat map of differentially expressed miRNAs in Doxy-treated [24 hours (h)] K562-ShMYB and BV173-ShMYB cells. MiRNA expression levels are shown as color variations. Higher and lower values are represented by red and green points, respectively. Pairwise distances between rows and between columns were computed by Euclide distance metric. (B) Venn diagram of differentially expressed miRNAs: 35 miRNAs are commonly modulated in the indicated cell lines. (C and D) qRT-PCR of 5 selected miRNAs from the 15 miRNAs modulated in the same direction in untreated (Not Treated; NT) or Doxy-treated (24-48 h) K562- and BV173-ShMYB cells. Samples were normalized for RNU44 expression. Relative expression was calculated using the comparative Ct method. Data are the average of three independent experiments; error bars indi- cate SEM. P-values (*P≤0.05; **P≤0.01) were determined using Student t-test. (E) Schematic representation of members of miR-17-92 cluster included in the MIR17HG gene on Chr13q31.3. Arrows represent the direction of miRNA modulation based on the microarray experiment in K562-ShMYB (white) and BV173-ShMYB (black). (F and G) qRT-PCR of the indicated members of miR-17-92 cluster in NT or Doxy-treated (24-48 h) K562-ShMYB and BV173-ShMYB cells. Samples were nor- malized for RNU44 expression. QRT-PCR was performed in triplicate, including no-template controls. Relative expression was calculated using the comparative Ct method. Data are the average of three independent experiments; error bars indicate Standard Error of Mean. P-values were determined using Student t-test. *P≤0.05; **P≤0.01.
84
haematologica | 2019; 104(1)
