
Page 76 - 2019_01-Haematologica-web
P. 76
J. Stomper et al.
AB
C
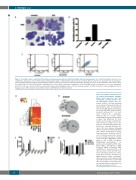
Figure 5. Decitabine induces erythroid differentiation and hemoglobin synthesis in K562 and HEL early myeloid progenitor cells. (A) K562 and HEL cells were treat- ed with three 24 h pulses of 100 nM decitabine. Morphological signs of erythroid differentiation upon decitabine (DAC) treatment were determined by cytospin prepa- ration and May-Grünwald staining. (B) Hemoglobin synthesis in K562 cells was determined by benzidine staining. Cells were treated with DAC (three 24 h pulses, 100 nM), hemin (50 mM for 48 h), phorbol 12-myristate 13-acetate (PMA, 5 nM) and a combination of DAC and PMA at these concentrations. For each experimental point, 300 cells were counted, with blue cells being considered hemoglobin-positive. (C) Flow cytometry analysis of CD41/61 surface markers (highly specific for megakaryocytic differentiation) showed differentiation with PMA but not DAC treatment.
Figure 6. Decitabine treatment induces AB an erythroid transcriptome signature, globin chain expression and fetal hemoglobin assembly in K562 cells. (A) Transcriptome analyses were per- formed in K562 cells upon treatment (as described in the legend to Figure 5) with decitabine (DAC, 100 nM), hemin (25 and 50 mM), phorbol 12-myristate 13-acetate PMA (PMA, 5 nM) or without treatment (untreated #1 – no treat- ment, untreated #2 – phosphate- buffered saline as a vehicle control) using mRNA microarrays (HG-U133plus 2.0 gene chip, Affymetrix). The most variable probes (relative standard devi- ation among all samples ≥2) are dis- played as a heatmap with unsupervised hierarchical clustering (Euclidian dis- tance). (B) Venn diagram displaying unique and shared ≥2-fold upregulated and ≥2-fold downregulated probes between the three treatments in K562 cells. (C) Relative mean probe intensi- ties representing expression of globin chain transcripts: HBA1/HBA2, alpha- globin 1 and 2; HBB, beta-globin; HBG1/HBG2, gamma-globin 1 (G- gamma) and 2 (A-gamma); HBD, delta- globin; HBE1, epsilon-globin 1; HBM, mu-globin; HBQ1, theta-globin, HBZ, zeta-globin) in untreated K562 cells and upon DAC, hemin and PMA treat- ment, respectively. (D) Increase of func- tional HbF tetramers determined by high-performance liquid chromatogra- phy as a fraction of total cellular protein upon DAC treatment (50 and 100 nM) after 72 and 144 h, respectively. Note the time-dependent incremental rise in
CD
HbF (dose-dependent at 72 h).
66
haematologica | 2019; 104(1)
