
Page 181 - 2019_01-Haematologica-web
P. 181
Prognostic markers in autoimmune TTP
exacerbation and relapse to remission (24.7%), and death (12.3%). Eight out of 9 patients who died within 35 days following admission were unresponsive and/or refractory to TPE; 1 patient died of unrelated disease one year after the initial therapy. Therefore, the overall remission rate was 87.5% despite exacerbation and/or relapse after a median follow up of 828 days (or 2.3 years) (95% CI of 326-1,720 days or 1-4.7 years) (Table 2).
ADAMTS13 activity and inhibitors in patients with iTTP
All patients except for 2 having ADAMTS13 activity of 13 and 26 U/dL, respectively) had plasma ADAMTS13 activity <5 U/dL (or <5% normal) (Figure 2A). However, these two samples were drawn by ordering physicians fol- lowing TPE or a large volume of plasma transfusion. However, the ADAMTS13 activity in pre-treatment sam- ples stored separately for research purposes was <5 U/dL. Therefore, all patients included in the study had severe deficiency of ADAMTS13 activity. ADAMTS13 inhibitors (>0.4 U/mL), measured by the 50/50 mixing study, were found to be present in 65 of 73 (89%) patients. There was no difference in the inhibitor titers in patients presenting during the initial and those with a relapse episode (Figure
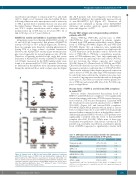
Figure 4. Plasma levels of HNP1-3 and histone/DNA complexes in patients with iTTP. Plasma levels of HNP1-3 (A) and histone/DNA complexes (B) in patients with acute iTTP (initial vs. exacerbated or relapsed) and healthy con- trols are shown as the dot plots for individual patients with the median ± 95% confidence intervals (solid red lines). Kruskal-Willis analysis was used to deter- mine the statistical significance. Here **** indicates P value <0.0001 when compared the values in the healthy controls.
2B). All 8 patients who tested negative (<0.4 U/mL) for ADAMTS13 inhibitors had significantly increased levels of anti-ADAMTS13 IgG (Figure 2C). Therefore, all patients were confirmed as having severe ADAMTS13 deficiency and positive antibody against ADAMTS13, hence the diagnosis of iTTP.
Plasma VWF antigen and collagen-binding activity in patients with iTTP
Plasma VWF-Ag, VWF-CBA, and the ratio of VWF- CBA/VWF-Ag were determined in plasma samples obtained from iTTP patients and healthy controls. Plasma levels of VWF-Ag (P<0.0001) (Figure 3A) and VWF-CBA (P<0.005) (Figure 3B) on admission were significantly higher in patients with either an initial or a relapse episode of iTTP than those in the healthy controls. However, the ratio of VWF-CBA to VWF-Ag, a quantitative measure- ment of VWF multimer size,21 was only significantly dif- ferent between the initial episodes and controls (P<0.01), but not between the relapse episodes and controls (P>0.05) (Figure 3C). Plasma levels of VWF-Ag and VWF- CBA were moderately associated with each other with a Spearman correlation coefficient (rho) of 0.592 (P<0.0001). These results indicated that despite increased expression and/or release of VWF, the ultra-large VWF multimers may be selectively removed from the circulation in some cases as a result of ongoing microvascular thrombosis during the acute episode. A positive association between plasma lev- els of VWF-Ag and serum LDH (rho=0.36, P=0.004) sup- ports our hypothesis.
Plasma levels of HNP1-3 and histone/DNA complexes in acute iTTP
Previous studies demonstrated that plasma levels of HNP1-38 and DNA/histone complexes20 were significantly elevated in patients with acute iTTP. However, their prog- nostic value in iTTP was not determined. Consistent with the results previously reported, plasma levels of HNP1-3 (P<0.0001) (Figure 4A) and histone/DNA complexes (P<0.0001) (Figure 4B) in patients with an initial or exacer- bated or relapsed episode of acute iTTP were dramatically increased when compared to those in the healthy controls. Additionally, plasma HNP1-3 levels in iTTP patients were significantly correlated with the levels of histone/DNA complex (rho=0.50, P<0.001). While none of these two biomarkers was predictive of an adverse outcome in iTTP patients (e.g., mortality, exacerbation, and relapse), plasma levels of HNP1-3 appeared to significantly correlate with
Table 4. COX hadard regression analysis identifies the statistically sig- nificant parameters that predict mortality in iTTP patients.
A
B
Parameters
Total protein (g/L)
Albumin (g/L)
aPTT (sec) Fibrinogen (mg/dL) ΔLDH (D5-D0) (U/L) Bb ( g/mL)
sC5b-9 ( g/mL)
*The hazard ratio (HR) was calculated based on the change (Δ) of LDH by 100 U/L, aPTT by 10 sec, fibrinogen by 100 mg/dL, Bb, and sC5-9 by 1 mg/mL, and change in LDH level by 100 U/L.
HR* (95% CI) P 0.37 (0.15-0.92) 0.03
0.23 (0.09-0.60)
2.03 (1.91-2.16) 0.02 1.90 (1.89-1.91) 0.03
2.93 (2.9-2.93) 0.04
1.30 (1.01-1.68) 0.04
0.003
1.54 (1.00-2.36) 0.05
haematologica | 2019; 104(1)
171
