
Page 182 - 2019_01-Haematologica-web
P. 182
E.M. Staley et al.
serum troponin (rho=0.37, P<0.05) and LDH (rho=0.48, P<0.001). The plasma levels of histone/DNA complex were also correlated with serum LDH (rho=0.66, P<0.0001), but not troponin. Noticeably, serum troponin was elevated in 35 of 37 (~95%) patients tested in the ED, and remained elevated in 59 of 68 (~87%) patients tested after being admitted to hospital (prior to TPE). These results suggest that plasma levels of HNP1-3 and his- tone/DNA complexes may also be markers of organ injury in addition to serum LDH and troponin in patients with acute iTTP.
Plasma levels of complement activation markers in acute iTTP
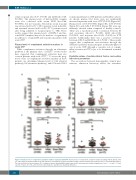
While complement activation through an alternative pathway is the primary cause of aHUS,22 recent studies have suggested that complement activation may also occur in patients with acute iTTP.23-25 To assess the prog- nostic value of complement activation markers in these patients, we determined plasma levels of C4d (classical pathway), Bb (alternative pathway), and iC3b and sC5b-9
(common pathway) in iTTP patients and healthy controls. As shown, plasma C4d levels were not significantly increased in patients with acute iTTP (P>0.05) (Figure 5A). Plasma levels of Bb (P<0.0001) (Figure 5B), iC3b (P<0.01) (Figure 5C), and sC5b-9 (P<0.0001) (Figure 5D) were sig- nificantly elevated when compared to healthy controls. There was a modestly positive correlation between Bb and creatinine (rho=0.3, P<0.05), LDH (rho=0.65, P<0.0001), and troponin (rho=0.329, P<0.05) in iTTP patients. Additionally, there was a positive correlation between sC5b-9 and LDH (rho=0.4, P<001 ). These results suggest that complement over-activation through the alternative pathway may participate in the pathophysiol- ogy of acute iTTP, although a causative role of comple- ment activation in iTTP is yet to be determined in animal models.
Predictive values of certain clinical factors and routine laboratory parameters
The associations between demographics, clinical pres- entation, admission laboratory values, the aforemen-
AB
CD
Figure 5. Plasma levels of complement activation markers in patients with iTTP. Plasma levels of complement activation markers including C4d (A), Bb (B), iC3b (C), and sC5b-9 (D) in patients with acute iTTP (initial vs. exacterbated or relapsed) and the healthy controls. Each dot represents the value of each individual subject. The red solid lines are the medians ± 95% confidence interval. Kruskal-Willis analysis was used to determine the statistical significance. Here *, **, and **** indi- cate the P values of <0.01, and <0.0001, respectively; n.s. stands for no statistical difference.
172
haematologica | 2019; 104(1)
