
Page 178 - 2019_01-Haematologica-web
P. 178
E.M. Staley et al.
Statistical Analysis
The data were expressed as the medians and 95% confidence intervals (95% CI) for most parameters unless specified otherwise. Mann-Whitney (for two groups) and Kruskal-Willis tests (for mul- tiple groups) for continuous variables and Fisher exact test for cate- gorical variables were performed, with descriptive statistics to sum- marize both quantitative and categorical variables. Association between various demographic, clinical, and laboratory parameters with clinical outcomes such as mortality, remission, exacerbation, relapse, etc. were also determined using univariate analysis and spearman correlation tests. Furthermore, Cox proportional hazard
regression was used to determine the hazard ratios for the predic- tive variables. P-values of <0.05 and <0.01 were deemed statistical- ly significant and highly significantly, respectively.
Results
Clinical and admission laboratory characteristics of the Alabama iTTP cohort
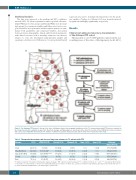
The majority of our 73 iTTP patients came from the sur- rounding areas of the cities of Montgomery (n=16, 22%),
AB
Figure 1. The Alabama TTP Cohort. A. A map of the state of Alabama denotes the geographic distribution of the 73 unique patients with iTTP that were included in the study. Five patients residing in Oregon, Ohio, New York, Georgia, and Mississippi are not shown on the map. The location of the UAB Medical Center is marked with a blue star. B. Algorithm demonstrates the number of admissions, patients being excluded, and the final cohort of patients in the study.
Table 2. Therapeutic interventions and observed long-term outcomes in 73 patients with iTTP.
Outcome
Rem.
Exac/Rel.-Rem. Exac.& Rel.-Rem. Death
Total
N (%)
22 (30.1)
24 (32.9) 18 (24.7) 9 (12.3)
73 (100)
#TPE (95% CI)$
8 (6-12)
16.5 (13-21)* 31.5 (18-46)****
6 (1-12)n.s.
15 (12-17)
Steriods N (%)
19 (26.2)
19 (26.2) 17 (23.3) 4 (5.4)
69 (94.5)
Rituxan N (%)
3 (4.1)
11 (15.1)
10 (13.7)
4 (5.4)
28 (38.4)
Vincr. N (%)
0 (0)
2 (2.7)
2 (2.7)
1 (1.4)
5 (6.8)
Splen. N (%) Follow up$ (days) (95% CI)
1 (1.4) 1090 (73-2631)
0 (0) 686 (211-1690)
3 (4.1) 1587 (115-2390)
0 (0) 817 (118-2390)
4 (5.4) 828 (326-1720)
N: number of patients; $: the number of therapeutuc plasma exchange (TPE) expressed as the median and 95% confidence interval (CI). * and **** stars indicate the P valules <0.05 and P<0.0001,respectively. n.s.refers to not statistically signficant or P value >0.05.Rem.,exac.,and rel.,are remission,exacerbation,and relapse,respectively. Steroids:cor- ticosteriods; Rituxan: rituximab;Vincr.: vincristine; Splen.: splenectomy.
168
haematologica | 2019; 104(1)
