
Page 115 - 2019_01-Haematologica-web
P. 115
2-Bromopalmitate promotes APL differentiation
Results
2BP enhances differentiation induction of ATRA in APL cell lines and primary blasts from APL patients
ATRA-sensitive NB4 cells were treated with different concentrations of 2BP (Figure 1A) and cell growth was determined. 2BP inhibited cell growth in a concentration- dependent manner (Figure 1B), with an increased percent- age of cells at the G1 stage (Online Supplementary Figure S1). 2BP treatment induced a slight decrease of cell viabil- ity at 40 mM in NB4 cells (Figure 1C). The effects of 2BP on normal CD34+ hematopoietic cells purified from bone marrow samples of 3 healthy donors were also assessed. The viability of CD34+ hematopoietic cells in the 2BP- treated group was comparable with that in the vehicle- treated group (Figure 1D). Next, we assessed the cellular effects of 2BP in combination with ATRA. As depicted in Figure 1E and F, the 2BP and ATRA combination synergis- tically induced growth arrest without inducing apparent apoptosis (Online Supplementary Figure S2). Intriguingly, 2BP alone at nontoxic concentrations 5 mM or 10 mM did not induce apparent differentiation of NB4 cells, but it sig- nificantly increased ATRA-induced granulocytic differen- tiation, as evidenced by mature granulocytic morphologic features (such as smaller cell size, reduced nucleus-cyto- plasm ratio, condensed chromatin, curveted or polylobu- lated nuclei) (Figure 1G), increased NBT reduction (Figure 1H), and percentage of CD11b (Figure 1I), CD11c (Figure 1J) and CD15 (Figure 1K) cells. Quantitative analysis based
on the shape of nuclei demonstrated more mature granu- locytic cells upon combination of 2BP with ATRA (bottom panel, Figure 1G). Notably, cotreatment of 2BP with ATRA also increased the percentage of CD11b and CD11c positive cells in another APL cell line, HL60 (Online Supplementary Figure S3). More importantly, the synergistic effect exhibited by the use of 2BP and ATRA combination in differentiation could also be seen in primary blasts from APL patients. The percentage of CD11b-positive cells treated with ATRA and 2BP was significantly increased in 7 out of 11 samples compared with the ATRA-treated group (Table 1). Notably, two APL samples with complex chromosome abnormalities (No. 6 and No. 7) which usu- ally do not respond well to ATRA-based therapy dis- played significant differentiation under treatment with ATRA and 2BP. Collectively, these data demonstrated that 2BP presents a synergistic differentiation-enhancing effect in APL cells when used in combination with ATRA.
As mentioned above, combination of ATO with ATRA have dramatically improved the CR rate of APL patients, and is now used as a frontline treatment of APL.15,19,20 Therefore, we further evaluated the effect of the combina- tion of ATO and 2BP on NB4 cells by flow cytometry. As shown in Online Supplementary Figure S4A, upon treatment of ATO/2BP, the expression of CD11b and CD11c was significantly increased on day 2 and day 3 compared with ATO-treated cells. Moreover, addition of 2BP enhanced the granulocytic differentiation of NB4 cells induced by ATRA/ATO (Online Supplementary Figure S4A). These data
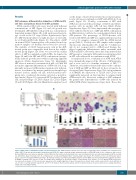
AB
C
D
Figure 2. 2BP enhances ATRA-induced APL cell differentiation in vivo. ATRA-sensitive leukemic (leu) mice were treated with vehicle (5% DMSO, 5% cremophor, 90% saline), 2BP (5 mg per kg body weight, intraperitoneally), ATRA (10 mg per kg body weight, intraperitoneally) or ATRA/2BP daily for five continuous days a week. Normal FVB/N mice were taken as negative controls. When the first vehicle-treated leukemic mice were moribund, all mice were killed and analyzed. (A) The survival (%) and lifetime (day) of leukemic mice in each group were recorded and Kaplan–Meier survival analysis was shown. The numbers of mice are indicated in paren- theses, and *P<0.05 against ATRA-treated mice. (B) Cytologic analysis of peripheral blood (PB) and bone marrow (BM) cells derived from different agent-treated mice by Wright’s staining. Scale bars are 20 mm. The images were quantified as described in Figure 1G and shown at the bottom. *P<0.05 against ATRA-treated mice. Leu represents leukemia. (C) The macroscopic appearance/the weight (mg/g bw) of spleen (top panels) are shown. Each column represents the mean with bar as s.d. of 3 mice in an independent experiment, and *P<0.05 between the line-pointed group. (D) The leukemic invasions in spleen and liver were analyzed by hema- toxylin and eosin (H&E) staining.
haematologica | 2019; 104(1)
105
