
Page 114 - 2019_01-Haematologica-web
P. 114
Y. Lu et al.
Wright–Giemsa staining PML-RARα transgenic mice were injected into 6- to 8-week-old
female FVB/N mice intravenously after sublethal irradiation.29 Two days after transplantation, the mice were treated with vehi- cle, 2BP, ATRA, ATO, or combination of these compounds. The peripheral blood (PB) and bone marrow (BM) cells were collected for morphological analysis. The spleen and liver were isolated for hematoxylin and eosin staining. Animal handling was approved by the committee for humane treatment of animals at Shanghai Jiao Tong University School of Medicine.
Statistical analysis
Statistical analyses between the control and treatment groups were performed by standard two-tailed Student's t-test. All exper- iments were repeated at least three times. A value of P<0.05 was considered to be statistically significant.
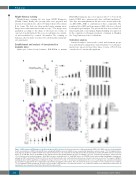
Figure 1. 2BP enhances ATRA-induced cell differentiation in APL cell lines. (A) Chemical structure of 2-Bromopalmitate (2BP). (B-C) NB4 cells were treated with dif- ferent concentrations of 2BP for 24 and 48 hours, and growth inhibition and cell viability % were evaluated by trypan-blue exclusion assay. *P<0.05 against vehicle- treated group. (D) Effects of 2BP on CD34+ bone marrow mononuclear cells isolated from 3 healthy donors (#1, #2 and #3) are shown. (E-F) NB4 cells were incubated with 5 or 10 mM 2BP and/or 10-8M ATRA for the indicated hours and growth inhibition (E) and cell viability % (F) were evaluated by trypan-blue exclusion assay. *P<0.05 between the line-pointed group. (G-K) NB4 cells were incubated with 5 or 10mM 2BP and/or 10-8M ATRA for the indicated days and Wright’s staining mor- phology (G), NBT reduction(H), CD11b-(I), CD11c-(J) and CD15-positive(K) cells counted by flow cytometry are shown. Scale bars are 20 mm. The images of Wright’s staining (G) were further quantified according to the shape of nuclei (0= round, 1= curveted, 2= polylobulated). The score of each figure was calculated, normalized by cell number (counted from three independent experiments) and shown at the bottom. The ratio shows the total score/number of cells counted in each condition. *P<0.05 against ATRA-treated group. All values for percentage of NBT-positive cells represent means ± s.d. of triplicate samples in an independent experiment. All experiments were repeated at least three times with the same results.
Wright-Giemsa staining kit was from BASO Diagnostic (Zhuhai, China). Briefly, the cytospin slides were prepared and solution A was added onto cells for 3-5 mins followed by solution B for 1 min. The slide was then washed under running water. Images were taken under inverted microscope.28 The images were quantified according to the shape of the nuclei (0= round, 1= curveted, 2= polylobulated). The score of each figure was calculat- ed and normalized by counted cell number. The counting of leukemic cells was made on at least 100 cells from three independ- ent experiments.
Establishment and analysis of transplantation leukemic mice
Splenocytes isolated from leukemic PML-RARα or mutant
ABC
DEF
GHI
J
K
104
haematologica | 2019; 104(1)
