
Page 51 - 2018_12-Haematologica-web
P. 51
TWIST1 regulates normal hematopoiesis and leukemia
gression of MLL-AF9-induced AML by increasing the expansion and leukemogenic capacity of LSC.
Microenvironmental Twist1 deletion promotes acute myeloid leukemia development partially through the Notch signaling pathway
To understand the mechanism underlying TWIST1 func- tion in the development of AML, we performed RNA-
sequencing analysis on BM stromal cells isolated from Twist1-deleted or control chimeric mice. There were 6948 differentially expressed genes (4764 downregulated and 2184 upregulated; fold change of >2 and P value <0.05). Analysis of leukemia-related signaling revealed a marked increase of Jagged-2 expression in stromal cells from Twist1- deleted mice (Figure 6A). Previous studies have demon- strated that TWIST1 regulates the Notch pathway in
AB
C
D
EF
GH
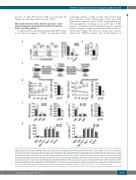
Figure 4. Twist1 deletion causes impaired quiescence, self-renewal of hematopoietic stem cells and myeloid skewing. (A) Percentage of the cell cycle distribution of CD34-LSK (Lin-Sca-1+c-Kit+) cells in chimeric control (Ctrl) and knockout (KO) mice. Representative flow activated cell sorting profiles are shown on the left, and cell frequency is shown on the right (n=4-5, two independent experiments). (B) Proliferation analysis of CD34-LSK cells in chimeric Ctrl and KO mice (n=4-5, two inde- pendent experiments). (C) Schematic overview of the serial transplantation assay. (D) Percentages of donor-derived peripheral blood (PB) cells and bone marrow (BM) cells after the primary and secondary competitive transplants (n=5, two independent experiments). (E-F) Frequency (E) and number (F) of common myeloid progen- itors (CMP, CD34+CD16/32-Lin-Sca-1-c-Kit+), granulocyte/macrophage progenitors (GMP, CD34+CD16/32+Lin-Sca-1-c-Kit+), megakaryocyte/erythroid progenitors (MEP, CD34-CD16/32-Lin-Sca-1-c-Kit+) and common lymphoid progenitors (CLP, Lin−Sca-1lowc-KitlowIL7R+) in chimeric Ctrl and KO mice (n=4-5, three independent experi- ments). (G-H) Frequency (G) and number (H) of B cells (B220+), T cells (CD3+), myeloid cells (Mac-1+ and Gr-1+) and erythrocytes (Ter119+) in chimeric Ctrl and KO mice (n=4-5, three independent experiments). Column plots show the mean ± standard deviation. *P<0.05; **P<0.01; ***P< 0.001 (Student t test).
haematologica | 2018; 103(12)
1975
