
Page 49 - 2018_12-Haematologica-web
P. 49
TWIST1 regulates normal hematopoiesis and leukemia
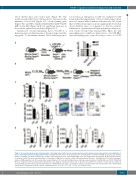
Twist1-deleted mice and control mice (Figure 3B). The results revealed that Twist1 deletion led to decreases in the numbers of total cells (Figure 3C), colony-forming units (Figure 3D), and HSC-enriched SLAM LSK (CD150+CD48- LSK) in the BM (Figure 3E,F) but significant increases in those in the spleen and circulation (Figure 3G-J).
Granulocyte colony-stimulating factor (G-CSF) is a hematopoietic cytokine known as the prototypic mobiliz- ing agent.31 To determine whether Twist1 deletion promot-
A
B
CDE
F
ed secretion of endogenous G-CSF, we examined G-CSF levels in the BM supernatants of Twist1-deleted and control mice by enzyme-linked immunosorbent assay. We found that G-CSF protein expression was significantly elevated in Twist1-deficient mice as compared to that in controls. Furthermore, quantitative real-time polymerase chain reac- tion results revealed that among MSC, OLC, EC and macrophagocytes, which are all producers of G-CSF, OLC and macrophagocytes were the major source of G-CSF
GHIJ
Figure 3. Decreased hematopoietic stem/progenitor cell homing and retention in bone marrow and increased hematopoietic stem/progenitor cell mobilization to spleen and peripheral blood in Twist1-deficient mice. (A) Experimental scheme of the hematopoietic stem/progenitor cell (HSPC) homing assay (left), and absolute number of CD45.1+ and CD45.1+LSK (Lin-Sca-1+c-Kit+) cells homing to the bone marrow (BM) (right) (n=5, two independent experiments). (B) Experimental scheme for analysis of HSPC retention and mobilization. (C-F) Analysis of BM cells of chimeric control (Ctrl) and knockout (KO) mice. Total BM cells (C) of femora and tibiae, number of BM progenitor cells (D) measured by colony-forming cell (CFC) assay in methylcellulose, and frequency and number of SLAM LSK cells (CD150+CD48-LSK) (E-F) are shown (n=4-6, three independent experiments). (G-J) Analysis of peripheral blood cells of chimeric Ctrl and KO mice. Number of total cells (G), number of colony-forming units (CFU) (H), frequency and number (I) of SLAM LSK cells in spleen, and number of CFU (J) in peripheral blood are shown (n=4-6, three independent experiments). Column plots show the mean ± standard deviation. *P<0.05; **P<0.01; ***P<0.001 (Student t test).
haematologica | 2018; 103(12)
1973
