
Page 47 - 2018_12-Haematologica-web
P. 47
TWIST1 regulates normal hematopoiesis and leukemia
a reduction of trabecular volume (Figure 1C). Collectively, Twist1 deletion promotes MSC to differentiate toward the osteoblast lineage with a block of mature osteoblast differ- entiation.
Emerging data demonstrate the role of vascular EC in HSC maintenance, and arterioles and sinusoids exhibit dif-
AB
C
D
E
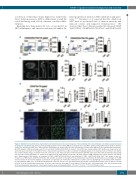
ferent properties in relation to HSC distribution and quies- cence.4,25,26 Ciuculescu et al. reported that Rac deletion in MSC leads to an inverted ratio of marrow arterioles and sinusoid vessels and impaired hematopoiesis.27 We observed that Twist1 deletion resulted in increased CD45- Ter119-CD31+, CD45-Ter119-CD31+Sca1+ and CD45-Ter119-
Figure 1. Twist1 deficiency in the bone marrow microenvironment leads to decreased frequency of mesenchymal stem cells and mature osteoblasts, and an increased proportion of endothelial cells. (A) Flow cytometry (FACS) analysis of bone marrow (BM) msesenchymal stem cells (MSC, CD140a+CD51+CD45/Ter119/CD31-) in chimeric control (Ctrl) and knockout (KO) mice. Representative FACS profiles are shown on the left, and cell frequency is shown on the right (n=4, three independent experiments). (B) FACS analysis of BM osteolineage cells (OLC, Sca-1-CD166+CD45/Ter119/CD31-) in chimeric Ctrl and KO mice. Representative FACS profiles are shown on the left, and cell frequency is shown on the right (n=5, three independent experiments). (C) Micro-computed tomography analysis of the trabecular bone of chimeric Ctrl and KO mice. Representative images are shown on the left. Scale bars, 1 mm. Trabecular bone volume/total volume (BT/BV), trabecular number (Tb. N) and trabecular spacing (Tb. Sp) in the femoral metaphysis are shown on the right (n=4, two independent experiments). (D) FACS analysis of BM endothelial cells (EC) in chimeric Ctrl and KO mice. Representative FACS profiles of sinusoidal EC (SEC, CD45-Ter119-CD31+Sca-1-) and arteriolar EC (AEC, CD45-Ter119-CD31+Sca-1+) are shown on the left. Frequencies of BM total EC (CD45-Ter119-CD31+), AEC and SEC are shown on the right (n=6, two independent experiments). (E) Immunofluorescent images of the BM microvasculature in the femoral diaphysis of animals of each genotype are shown after staining for Sca-1 (white, arteries), Endoglin (green, sinusoids) and 4’,6-diamidi- no-2-phenylindole (DAPI, blue), as detailed in the Methods. Scale bars, 40 mm. (n=3, two independent experiments). (F) Proliferation analysis of EC in chimeric Ctrl and KO mice (n=4, two independent experiments). (G) In vitro tube formation assay with EC from chimeric Ctrl and KO mice. (H) Quantification of the tube formation assay (n=3, two independent experiments). Column plots show the mean ± standard deviation. *P<0.05; **P<0.01, ***P<0.001 (Student t test).
FH
G
haematologica | 2018; 103(12)
1971
