
Page 158 - 2018_12-Haematologica-web
P. 158
A. Spencer et al.
AB
C
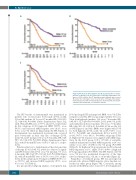
Figure 1.PFS (A) in the ITT population and (B) in patients who received 1 prior line of therapy or (C) 2 to 3 prior lines of therapy. Kaplan-Meier esti- mates of PFS. in (A) the the ITT population and in patients who received (B) 1 prior line of therapy or (C) 2 to 3 prior lines of therapy. D-Vd: daratu- mumab plus bortezomib and dexamethasone; Vd: bortezomib and dexam- ethasone; HR: hazard ratio; CI: confidence interval.
The PFS benefit of daratumumab was maintained in patients who received prior bortezomib (D-Vd, n=162; Vd, n=164; median: 12.1 versus 6.7 months; HR, 0.35; 95% CI, 0.26-0.46; P<0.0001 [Online Supplementary Figure S3]), with 18-month PFS rates of 37.9% and 1.8%, respectively. In this subgroup, D-Vd improved ORR (80.5% versus 59.5%) and increased MRD-negative rates (6.2% versus 0.6%) versus Vd (Table 2). Importantly, the PFS benefit of daratumumab was maintained in patients who received prior bortezomib in their only line of therapy (D-Vd, n=62; Vd, n=57; median: 19.6 versus 8.0 months; HR, 0.20; 95% CI, 0.12-0.35; P<0.0001 [Online Supplementary Figure S4]), with 18-month PFS rates of 58.1% and 2.1%, respec- tively.
Patients refractory to lenalidomide at their last prior line of therapy (D-Vd, n=45; Vd, n=60) also achieved a signifi- cant PFS benefit with D-Vd versus Vd (median: 9.3 versus 4.4 months; HR, 0.36; 95% CI, 0.21-0.63; P=0.0002 [Figure 2]), with 18-month PFS rates of 33.5% versus 2.0%, respec- tively. In this subgroup, D-Vd improved ORR (80.5% ver- sus 50.0%) and increased MRD negativity (8.9% versus 0%) versus Vd [Table 2].
In a pre-specified subgroup analysis of cytogenetic risk,
D-Vd prolonged PFS and improved ORR versus Vd (Table 2, Figures 2 and 3A). PFS was prolonged with D-Vd versus Vd in both high-risk (median: 11.2 versus 7.2 months; HR, 0.45; 95% CI, 0.25-0.80; P=0.0053; D-Vd, n=44; Vd, n=51) and standard-risk disease (median: 19.6 versus 7.0 months; HR: 0.26; 95% CI, 0.18-0.37; P<0.0001; D-Vd, n=123; Vd, n=135 [Figures 2 and 3A]). ORRs were higher with D-Vd for both high-risk (D-Vd, n=44; Vd, n=47; 81.8% versus 61.7%; P=0.2028) and standard-risk (D-Vd, n=118; Vd, n=131; 84.7% versus 64.1%; P=0.0001) subgroups (Table 2). Higher D-Vd response rates aligned with MRD nega- tivity. In the D-Vd group, 13.8% (17/123) of evaluable, standard-risk patients reached MRD negativity at 10–5 sen- sitivity versus 2.2% (3/135) in the Vd group (P=0.0003 [Table 2]). No high-risk Vd group patients (n=51) achieved MRD negativity at 10–5, unlike 13.6% (6/44) of high-risk D-Vd group patients (P=0.0018). The PFS benefit of D-Vd versus Vd was also maintained irrespective of the time since last therapy (≤12, >12, ≤6, or >6 months [Figure 2]).
Regardless of treatment group, PFS was prolonged in patients who achieved MRD-negative status (median: not reached in either group [Figure 3B]). Conversely, among patients with MRD-positive status (10–5), D-Vd significant-
2082
haematologica | 2018; 103(12)
