
Page 157 - 2018_12-Haematologica-web
P. 157
Subgroup analyses of CASTOR
of life (HRQoL) was assessed by the European Organization for Research and Treatment of Cancer Quality of Life Questionnaire Core-30 EORTC QLQ-C30 and the EuroQol 5 Dimensions Questionnaire (EQ-5D-5L) tools.
The Online Supplementary Appendix provides full details of statistical analyses and MRD, cytogenetic, and HRQoL assessments.
Results
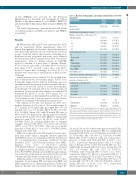
Of 498 patients, 251 and 247 were randomized to D-Vd and Vd, respectively (Online Supplementary Figure S1). Patient demographics and baseline clinical characteristics were previously published and are well-balanced between groups.13 Relevant clinical characteristics, including treat- ment history and cytogenetic-risk status, were balanced between groups and are summarized in Table 1 and Online Supplementary Table S1. Briefly, patients in CASTOR received a median of 2 prior lines of therapy. Overall, 47.2% received 1 prior line of therapy, 28.9% received 2 prior lines, 13.9% received 3 prior lines, and 10.0% received >3 prior lines of therapy. A total of 21.1% of patients were refractory to lenalidomide at their last line of therapy.
Among patients treated with D-Vd, the median dura- tion of treatment was 13.4 months (range: 0-26.7) versus 5.2 months (range: 0.2-8.0) with Vd. Following a protocol amendment after the primary analysis, patients who pro- gressed on Vd had the option to receive daratumumab monotherapy.13 At a median follow up of 19.4 months, all patients in both groups had discontinued or completed Vd treatment per protocol; in the D-Vd group, 41% of patients remained on daratumumab monotherapy. A total of 64 patients in the Vd group opted to receive daratu- mumab monotherapy following disease progression.
The clinical cut-off date was January 11, 2017. At a median duration of follow up of 19.4 months (range: 0- 27.7) months, D-Vd significantly prolonged PFS versus Vd (median: 16.7 versus 7.1 months; HR, 0.31; 95% CI, 0.24- 0.39; P<0.0001 [Figure 1A]), with 18-month PFS rates of 48.0% and 7.9%, respectively. Among response-evaluable patients (D-Vd, n=240; Vd, n=234), ORR was significantly improved with D-Vd versus Vd (83.8% versus 63.2%; P<0.0001 [Table 2]), including higher rates of stringent complete response (CR) (8.8% versus 2.6%), CR or better (28.8% versus 9.8%; P<0.0001), and very good partial response or better (62.1% versus 29.1%; P<0.0001 [Online Supplementary Table S2]).
MRD was evaluated for the ITT population at pre-spec- ified time points using a stringent, unbiased approach with IMWG criteria of a minimum sensitivity threshold of 10–5 for next-generation sequencing evaluation.20 At this threshold, 11.6% of D-Vd–treated patients were MRD- negative versus 2.4% of Vd-treated patients (P=0.000034 [Table 2]). Consistent findings were observed at a higher sensitivity threshold of 10–6 (D-Vd: 4.8%; Vd: 0.8%; P=0.004763). Overall survival (OS) remained imma- ture at the time of this analysis, and survival follow up will continue until 320 deaths are reported, per protocol.
Subgroup analyses showed the clinical benefit of dara- tumumab by prolonging PFS and improving ORR and MRD negativity across all clinical populations (Table 2 and Figure 2). Patients who received D-Vd at first relapse (D-
Table 1. Baseline demographics and clinical characteristics of the ITT population.
Characteristic
Age (years)
median (range)
Median time from diagnosis (years) Number of prior lines of therapy, n (%)
Median (range) 1
2-3 >3 1-3
Prior treatments, n (%)
PI Bortezomib
IMiD Thalidomide Lenalidomide
PI and IMiD
Prior ASCT, n (%)
Refractory to last line of therapy, n (%) Refractory to lenalidomide at last prior line of therapy, n (%) Treatment-free interval, n (%)
>12 months ≤12 months >6 months ≤6 months
Cytogenetic profile, n (%)a n
Standard-risk
High-risk
D-Vd n=251
64 (30-88)
3.9
2 (1-9) 122 (48.6) 107 (42.6) 22 (8.8) 229 (91.2)
169 (67.3) 162 (64.5) 179 (71.3) 125 (49.8) 89 (35.5) 112 (44.6) 157 (62.5) 76 (30.3) 45 (17.9)
118 (47.0) 133 (53.0) 150 (59.8) 101 (40.2)
167
123 (73.7)
44 (26.3)
Vd n=247
64 (33-85)
3.7
2 (1-10) 113 (45.7) 106 (42.9) 28 (11.3) 219 (88.7)
172 (69.6) 164 (66.4) 198 (80.2) 121 (49.0) 120 (48.6) 129 (52.2) 149 (60.3) 85 (34.4) 60 (24.3)
104 (42.1) 143 (57.9) 133 (53.8) 114 (46.2)
186
135 (72.6)
51 (27.4)
ITT: intent-to-treat; D-Vd: daratumumab plus bortezomib and dexamethasone; Vd: bortezomib and dexamethasone; PI: proteasome inhibitor; IMiD: immunomodulatory drug; ASCT: autologous stem cell transplantation; data are median (range) or n (%). aCytogenetic status was determined using next-generation sequencing.High-risk cyto- genetic status was defined as having ≥1 of the following abnormalities: del17p, t(4;14), or t(14;16); standard-risk cytogenetic status was defined as those who underwent cyto- genetic testing and did not meet the high-risk criteria.
Vd, n=122; Vd, n=113) achieved the greatest benefit [Table 2 and Figure 2]. In this population, PFS was significantly prolonged with D-Vd versus Vd (median: not reached ver- sus 7.9 months; HR, 0.19; 95% CI, 0.12-0.29; P<0.0001 [Figure 1B]), an 81% reduction in the risk of disease pro- gression or death with 18-month PFS of 68.0% versus 11.5%, respectively. Among patients with 2 to 3 prior lines of therapy (D-Vd, n=107; Vd, n=106), PFS was also significantly prolonged with D-Vd versus Vd (median: 9.8 versus 6.3 months; HR, 0.51; 95% CI, 0.36-0.71; P<0.0001), with 18-month PFS of 31.2% versus 5.5%, respectively (Figure 1C). Likewise, in patients with 1 to 3 prior lines of therapy (D-Vd, n=229; Vd, n=219), D-Vd sig- nificantly prolonged PFS versus Vd (median: 18.9 versus 7.3 months; HR, 0.31; 95% CI, 0.24-0.40; P<0.0001), with 18- month PFS rates of 51.2% versus 8.7%, respectively (Online Supplementary Figure S2).
haematologica | 2018; 103(12)
2081
