
Page 160 - 2018_12-Haematologica-web
P. 160
A. Spencer et al.
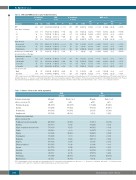
Table 2. ORR and MRD based on prior treatment history.
# of patients ORR, # of patients MRD, n (%)
in group n (%)a in group
Subgroup D-Vd Vd D-Vd Vd Pc D-Vd Vd D-Vd Vd Pd D-Vd Vd Pd
ITTb
Prior lines of therapy
1 2-3 >3 1-3
Prior therapy
Bortezomib Lenalidomide Thalidomide
240 234
119 109 99 100 22 25 218 209
154 153 83 112 120 115 41 58
125 135 115 99 94 107 146 127
44 47
118 131
201 (83.8) 148 (63.2) <0.0001
251 247
122 113 107 106 22 28 229 219
162 164 89 120 125 121 45 60
133 143 118 104 101 114 150 133
44 51
123 135
29 (11.6)
17 (13.9) 12 (11.2) N/A 29 (12.7)
10 (6.2) 7 (7.9) 16 (12.8) 4 (8.9)
13 (9.8) 16 (13.6) 8 (7.9) 21 (14.0)
6 (13.6)
17 (13.8)
10–5
6 (2.4) 0.000034
3 (2.7) 0.001138 3 (2.8) 0.013511 N/A N/A
6 (2.7) <0.0001
1 (0.6) 0.002822 2 (1.7) 0.0278 4 (3.3) 0.0049
0 (0) 0.008194
1 (0.7) 0.0002 5 (4.8) 0.0223 1 (0.9) 0.0067 5 (3.8) 0.0020
0 (0) 0.0018
3 (2.2) 0.0003
12 (4.8)
8 (6.6) 4 (3.7) N/A 12 (5.2)
5 (3.1) 2 (2.2) 6 (4.8) 1 (2.2)
4 (3.0) 8 (6.8) 3 (3.0) 9 (6.0)
5 (11.4)
6 (4.9)
10–6
2 (0.8)
2 (1.8) 0 (0) N/A 2 (0.9)
0 (0)
0 (0)
2 (1.7) 0 (0)
0 (0) 2 (1.9) 0 (0) 2 (1.5)
0 (0)
1 (0.7)
0.004763
0.059541 0.018130 N/A 0.0055
0.007830 0.0636 0.1544 0.191319
0.0151 0.0704 0.0323 0.0413
0.004
0.0328
108 (90.8) 78 (78.8) 15 (68.2)
81 (74.3) 58 (58.0) 9 (36.0)
0.0014 0.0022 0.0294
186 (85.3) 139 (66.5) <0.0001
Refractory to lenalidomide at last prior line of therapy Treatment-free interval
124 (80.5) 65 (78.3) 102 (85.0) 33 (80.5)
96 (76.8) 105 (91.3) 72 (76.6) 129 (88.4)
36 (81.8)
100 (84.7)
91 (59.5) 59 (52.7) 74 (64.3) 29 (50.0)
66 (48.9) 82 (82.8) 50 (46.7) 98 (77.2)
29 (61.7)
84 (64.1)
<0.0001 <0.0001 0.0003 0.0021
<0.0001 0.0632 <0.0001 0.0139
0.2028
0.0001
≤12 months >12 months ≤6 months >6 months
Cytogenetic riske Highf
Standard
ORR: overall response rate; MRD: minimal residual disease; D-Vd: daratumumab plus bortezomib and dexamethasone;Vd: bortezomib and dexamethasone; ITT: intent-to-treat; N/A: not available.Data are n (%) based on computerized algorithm. aResponse-evaluable population.bITT population.cP-value was generated using the Cochran-Mantel-Haenszel χ2 test.dP-value wasgeneratedusingthelikelihood-ratioχ2 test.eBiomarkerrisk-evaluablepopulation.fIncludessubjectswhohaveeitherdel17p,t(14;16),t(4;14),oracombinationofthese.
Table 3. Adverse events in the safety population.
Common hematologic adverse events, n (%) Thrombocytopenia
Anemia Neutropenia Lymphopenia
Common non-hematologic
adverse events, n (%)
Peripheral sensory neuropathy Diarrhea
Upper respiratory tract infection Cough
Fatigue
Constipation
Back pain
Dyspnea
Edema peripheral
Pyrexia
Insomnia
Asthenia
Pneumonia
Hypertension
All-grade ≥15% 145 (59.7) 69 (28.4) 46 (18.9) 32 (13.2)
121 (49.8) 85 (35.0) 76 (31.3) 68 (28.0) 53 (21.8) 53 (21.8) 47 (19.3) 46 (18.9) 45 (18.5) 43 (17.7) 42 (17.3) 24 (9.9) 36 (14.8) 23 (9.5)
Grade 3 or 4 ≥5% 111 (45.7) 37 (15.2) 33 (13.6) 24 (9.9)
11 (4.5) 9 (3.7) 6 (2.5) 0 (0.0) 12 (4.9) 0 (0.0) 5 (2.1) 9 (3.7) 1 (0.4) 3 (1.2) 2 (0.8) 2 (0.8) 24 (9.9) 16 (6.6)
All-grade ≥15% 105 (44.3) 75 (31.6) 23 (9.7) 9 (3.8)
90 (38.0) 53 (22.4) 43 (18.1) 30 (12.7) 58 (24.5) 38 (16.0) 24 (10.1) 21 (8.9) 20 (8.4) 28 (11.8) 36 (15.2) 37 (15.6) 31 (13.1) 8 (3.4)
Grade 3 or 4 ≥5%
78 (32.9) 38 (16.0) 11 (4.6)
6 (2.5)
16 (6.8) 3 (1.3) 1 (0.4) 0 (0.0) 8 (3.4) 2 (0.8) 3 (1.3) 2 (0.8) 0 (0.0) 3 (1.3) 3 (1.3) 5 (2.1) 24 (10.1) 2 (0.8)
D-Vd (n=243)
Vd (n=237)
D-Vd: daratumumab plus bortezomib and dexamethasone; Vd: occurring in ≥15% and ≥5% of patients in either treatment group
bortezomib and dexamethasone. Data are n (%). Incidences of all-grade and grade 3 or 4 adverse events are listed, respectively.
2084
haematologica | 2018; 103(12)
