
Page 106 - 2018_12-Haematologica-web
P. 106
I.S. Pagani et al.
ical outcome, yet the biology of BCR-ABL1 molecular response is relatively complex. Key to this complexity is the composite nature of the response: a reduction in the ratio of BCR-ABL1 mRNA to a control gene could be due to a reduction in the proportion of CML cells in the sam- ple, a reduction in the expression of BCR-ABL1, an increase in the expression of the control gene, or even a
change in the relative stability of these mRNA transcripts. Since the number of copies of genomic BCR-ABL1 is directly proportional to the number of leukemic cells, we reasoned that measuring both BCR-ABL1 DNA and mRNA would lead to a better understanding of the main determinants of variation in molecular response.
During the first three months of treatment, the
A
B
C
Months since starting TKI treatment
P=0.0005
Months since starting TKI treatment
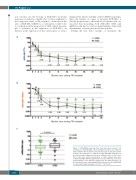
Figure 3. BCR-ABL1 transcript type and molecular response. (A) Comparison of the BCR-ABL1IS values during the first two years of tyrosine kinase inhibitor (TKI) treatment (e13a2 shown in green and e14a2 shown in black). (B) Comparison of e13a2 and e14a2 BCR-ABL1 DNA values in the same patients. Diagnostic values were assigned a value of 100%. Note that at later time points the proportion of e14a2 patients with unde- tectable BCR-ABL1 DNA was higher than for e13a2, which may result in an underestimation of the difference between the two transcript types. (C) Box and whiskers plot comparing BCR-ABL1 expression ratio (mRNA:DNA) for e13a2 and e14a2 transcripts. *P<0.05; ***P<0.001.
2030
haematologica | 2018; 103(12)
