
Page 104 - 2018_12-Haematologica-web
P. 104
I.S. Pagani et al.
AB
C
D
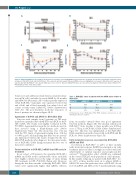
Figure 1. DNA and mRNA prior to treatment. (A) Proportion of leukemic cells and BCR-ABL1 expression before treatment assessed by conventional cytogenetic analy- sis (green), DNA dPCR (red) and RQ-PCR (blue). Three patients with discrepant DNA and mRNA values are highlighted (red square). (B-D) Molecular response of patients (pts) with BCR-ABL1IS <10% despite DNA values close to 100%. Absolute DNA dPCR values are represented at diagnosis. TKI: tyrosine kinase inhibitor; Ph+: Philadelphia positive; Und: undetectable.
Sokal score and additional clonal chromosomal abnormal- ities in Ph+ cells) and failed to reach MMR by 12 months and MR4.5 by 24 months. All 3 of these patients expressed e13a2 BCR-ABL1 transcripts (one expressed both e13a2 and e14a2) and all had unusually low white blood cell counts at study entry (<20x109/L) (Online Supplementary Table S3). The post-treatment molecular responses of these 3 patients are shown in Figure 1B-D.
Agreement of Q-PCR and dPCR for BCR-ABL1 DNA Forty-six serial samples from 9 patients on TKI treat- ment were quantified by both Q-PCR and dPCR for BCR- ABL1 DNA. The results were highly correlated (r=0.94, P<0.0001). Agreement between the two methods was fur- ther assessed using a Bland-Altman plot (Online Supplementary Figure S4). The mean bias was -0.11-log with the 95% limits of agreement ranging from -1.02-log to 0.80-log (±8.1 fold) indicating that there was no system- atic difference between the results obtained by the two DNA PCR methods after diagnosis. In subsequent analy- ses of BCR-ABL1 DNA during treatment the two sets of
data were combined.
Faster reduction in BCR-ABL1 mRNA than DNA early in treatment
In our cohort of 59 patients, the quantified BCR-ABL1 mRNA and DNA results (undetectable values excluded) were highly correlated across the range of values during TKI treatment (r=0.88; P<0.0001) (Figure 2A). However, during the first three months of therapy BCR-ABL1 DNA values were significantly higher than mRNA, whereas
Table 1. BCR-ABL1 values in patients with low mRNA values relative to DNA values.
Patient ID
#1
#2
#3
mRNA, IS%
6.96
5.10
3.70
DNA dPCR, %
88.0
81.2
101.8
iFISH, %
99.4
N/A
87.8
IS: International Scale; dPCR: digital PCR; iFISH: interphase fluorescence in situ hybridization; N/A: not available.
from six months onwards there was good agreement between methods (Figure 2B). The median reduction in BCR-ABL1IS from baseline to three months was 2.05-log versus 1.75-log for BCR-ABL1 DNA (Online Supplementary Figure S5). This bias was independent of the BCR-ABL1 DNA quantification method (seen with both dPCR and Q- PCR; see Online Supplementary Figure S6).
Early molecular response assessment by BCR-ABL1 mRNA and DNA
A reduction in BCR-ABL1IS to ≤10% at three months [early molecular response (EMR)] has emerged as an early treatment milestone that is strongly associated with later achievement of optimal response and progression-free survival.15,16 The predictive effect of EMR was confirmed in the overall TIDEL-II study population of 210 patients.9 In this smaller subgroup, no patient with BCR-ABL1IS lev- els >10% at three months went on to achieve MMR or MR4.5. We tested the predictive value of BCR-ABL1 levels by both mRNA and DNA at the 3-month landmark using
2028
haematologica | 2018; 103(12)
