
Page 105 - 2018_12-Haematologica-web
P. 105
BCR-ABL1 DNA monitoring of CML
A
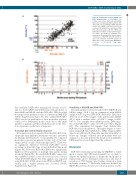
Figure 2. Comparison between mRNA and DNA quantification of BCR-ABL1. (A) Positive values from DNA (red) and mRNA (blue) were compared during treatment until 24 months. The quantifiable mRNA and DNA values were highly correlated, but at very low levels 42 samples were positive by DNA PCR only (red square). (B) The mRNA and DNA values (number, median and interquar- tile range) are shown for individual time points up to 24 months. Note that the appar- ent increase in RQ-PCR after 18 months is due to the exclusion of RQ-PCR samples in which there was undetectable BCR-ABL1. *P<0.05; ***P<0.0001; Und.: unde- tectable.
B
the established BCR-ABL1 transcript IS cut-offs of 10% and 1%. Both mRNA and DNA levels were predictive of later MMR and MR4.5, and the BCR-ABL1 DNA level did not improve the predictive value of conventional RQ-PCR (Online Supplementary Figure S7). The optimal BCR-ABL1 DNA cut-off for prediction of later molecular response could not be determined in this study due to the small number of patients and the potential bias due to the selec- tion of patients on the basis of response.
Transcript type and molecular response
It has previously been reported that the BCR-ABL1 tran- script type may influence treatment outcomes (reviewed by Marum and Branford17). Consequently, we compared molecular responses in patients having only e13a2 tran- scripts (n=32) or only e14a2 transcripts (n=17). There was no significant difference between BCR-ABL1IS levels according to transcript type at any individual time point (Figure 3A). However, BCR-ABL1 DNA was significantly higher in e13a2 patients at multiple time points during treatment (Figure 3B). The median BCR-ABL1 expression ratio (mRNA%:DNA%) was 0.5 for e13a2 versus 1.09 for e14a2 (P=0.0005) (Figure 3C). This analysis was repeated using BCR-ABL1 DNA values from dPCR and Q-PCR sep- arately and a similar pattern was observed (Online Supplementary Figure S8).
Sensitivity of RQ-PCR and DNA PCR
The median limit of detection achieved by RQ-PCR was MR4.6 (range, 3.2-5.1 log) in comparison with MR5.2 (range, 4.6-5.7 log) for DNA PCR. BCR-ABL1 DNA was detected in 42 of 86 samples with undetectable mRNA (49%) with a median value of 0.002% (range, 0.0002- 0.07%). Two samples were mRNA-positive, DNA-nega- tive with BCR-ABL1IS values of 0.003 and 0.02% (Figure 2A). The remaining 44 samples had undetectable BCR-ABL1 by both methods. The higher degree of sensi- tivity using BCR-ABL1 DNA led to MRD being quantifi- able for an additional 5-18 months (median 12 months) of follow up. Samples collected after 24 months were not analyzed, so in some patients the duration of quantifiable MRD may have been longer than this estimate.
Discussion
BCR-ABL1 molecular monitoring by RQ-PCR is relied upon to ensure that TKI-treated patients are on track to achieve an optimal response, to define the end points of clinical trials, and to determine criteria for a safe trial of cessation of TKI therapy after having sustained a deep molecular response.18-20 Molecular responses defined by RQ-PCR have been shown to be robust indicators of clin-
haematologica | 2018; 103(12)
2029
