
Page 99 - 2018_10-Haematologica-web
P. 99
Therapy-related ALL
cases with available conventional cytogenetics, 14 (18%) patients met the definition of monosomal karyotype (two or more distinct autosomal chromosome monosomies or one single autosomal monosomy in the presence of struc- tural abnormalities).16
The median latency for developing ALL was 6.8 years (0.8-50.7) from the time of original malignancy/disease diagnosis, and it was shorter in patients carrying the MLL gene rearrangement compared to patients carrying the Ph chromosome or other cytogenetic subgroups (2.8 years vs. 7.0 years vs. 8.0 years, P<0.01), respectively. Only cytoge- netics was independently associated with the interval duration for developing ALL (P=0.02) (Table 4).
Topoisomerase II inhibitors were administered as part of prior therapy in 41% (n=38) of the t-ALL cohort, and were given in combination with alkylators and radiation in the majority of patients. Prior topoisomerase II inhibitor exposure did not influence the latency period between the original disease diagnosis and ALL onset (P=0.45) or the cytogenetic profile (P=0.69).
All t-ALL patients except for one received induction therapy for ALL. HyperCVAD with or without tyrosine kinase inhibitors was the most commonly used regimen (n=48, 52%) to induce t-ALL patients. Median follow up for all patients and surviving t-ALL patients was 14.4 months (range: 0.2-181.7) and 17 months (range: 0.8- 181.7), respectively. Neither age (P=0.43), prior therapy (P=0.44), cytogenetic subgroup (P=0.51), prior diagnosis (P=0.51) nor the use allogeneic HCT (P=0.07) influenced OS for t-ALL patients in multivariate analysis (Online Supplementary Table S1). Nine (9.7%) patients had their original malignancies relapse after ALL diagnosis. However, 2-year OS was not different between patients who had recurrence of their original disease and those who did not (45% vs. 50%, P=0.91).
Comparison of outcomes of t-ALL and de novo ALL
The median follow up for all patients and for surviving patients were 26 months (range: 0.2-255.5) and 43.6 months (range: 0.3-255.5), respectively. The 2-year OS for all patients was 66.2% (95% CI 63.0-69.2). CR rate was similar for both t-ALL and de novo ALL patients (85%, P=0.88) as was the percentage of patients who underwent allogeneic HCT consolidation (53% vs. 61%, P=0.15). However, more patients with t-ALL were transplanted in
CR1 compared to de novo ALL (76% vs. 60%, P=0.05). The 2-year OS was inferior for t-ALL compared to de novo ALL (46.0% vs. 68.1%, P=0.001) (Figure 1A). In mul- tivariate analysis, age at ALL diagnosis (P<0.0001), WBC at diagnosis (P=0.003), cytogenetics (P<0.0001), sex (P=0.005), HCT (P=0.02) and leukemia phenotype (P=0.02) influenced OS for all patients. Interestingly, prior exposure to cytotoxic therapy before ALL onset (t-ALL) was not an independent predictor of OS [HR=1.32; 95%
CI: 0.97-1.80, P=0.08] (Table 5).
When analysis was restricted to the 613 patients who
underwent allogeneic HCT as part of their ALL therapy (t-ALL=49, de novo ALL=564), the median follow up was 25.5 months (range: 0.03-198.3) and 2-year OS was 58.5% (95% CI: 54.4-62.4) for all patients. The 2-year OS was sim- ilar for both t-ALL and de novo ALL (53.4% vs. 58.9%, P=0.68) despite more frequent use of reduced-intensity con- ditioning for t-ALL compared to de novo ALL (P<0.01) (Figure 1B). No difference was observed in non-relapse mor- tality (NRM) between t-ALL and de novo ALL (28.5% vs. 22.7%, P=0.38), respectively (Online Supplemental Figure S1).
For the 409 patients who did not undergo allogeneic HCT (t-ALL=44, de novo ALL=365), the 2-year OS was inferior for t-ALL compared to de novo ALL (27.1% vs. 52.9%, P=0.0004) (Online Supplemental Figure S2). Again, prior cytotoxic therapy before ALL onset (t-ALL) was not
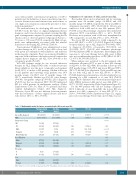
Table 2. Multivariable model for factors associated with t-ALL or de novo ALL.
Therapy-related N=88
54.5 (23-85)
9.95 (0.9-330)
16(18) 28 (32) 15 (17) 5 (6) 24 (27)
47(53) 25 (29) 16 (18)
De Novo
N=823
38 (18-85)
17 (0.2-778)
257(31) 223 (27) 39 (5) 34 (4) 270 (33)
280(34) 399 (48) 144 (18)
107(13) 716 (87)
Odds Ratio
1.06
0.996
95% CI P
Age at ALL diagnosis
WBC
Cytogenetic Group
NK
Ph+
MLL
Complex Other/Unknown
Race/Ethnicity
White Hispanic Other
1.04-1.07
0.99-1.00
<0.0001
0.038 0.0009
- -
1.46 0.74 -2.90 0.28
Phenotype
T 8(9) B 80 (91)
Sex
Male 38(43)
Female 50 (57)
- - 0.07 0.60 0.34-1.04 0.07 0.79 0.41-1.50 0.46
- -
6.52 2.66 -15.96
2.16 0.70-6.64 0.18 1.41 0.71-2.80 0.33
0.19
1.40 0.61-3.20 0.42
<0.0001
469(57) - -
354 (43) 1.64 1.02-2.65 0.04
WBC: white blood cell count; NK: normal karyotype; Ph+: Philadelphia chromosome positive; MLL: mixed lineage leukemia.
haematologica | 2018; 103(10)
1665
