
Page 101 - 2018_10-Haematologica-web
P. 101
Therapy-related ALL
of subsequent ALL therapy is a concern in t-ALL patients. t-ALL patients achieved a high CR rate and had low induc- tion mortality similar to de novo ALL, despite prior expo- sure to cytotoxic therapy. Although OS of t-ALL patients was inferior to de novo ALL patients, this was not inde- pendent in multivariate analysis. This is likely because t-ALL cases were enriched with poor prognostic factors that have driven the inferior outcomes of t-ALL cohort. Nonetheless, t-ALL patients who were able to receive allo-
geneic HCT fared better and had comparable OS to those with de novo ALL despite the more frequent use of reduced-intensity regimens. There was no increased risk of TRM among t-ALL patients who underwent allogeneic HCT despite prior cytotoxic exposure but this also could be related to earlier use of HCT (CR1) and more frequent use of RIC in this population.
The limitations of our study include the retrospective nature of the data collection and the inclusion of patients
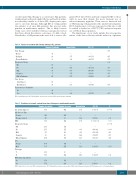
Table 4. Factors associated with latency among t-ALL patients.
Number of patients Hazard Ratio 95% CI P
Prior Therapy Chemo Radiation Chemo/Radiation
Cytogenetic Group
NK
Ph+
MLL
Complex Other/Unknown
Prior disease SolidCancer Blood Cancer
Topoisomerase II inhibitor
No
Yes
31 - -
0.75
NK: normal karyotype; Ph+: Philadelphia chromosome positive; MLL: mixed lineage leukemia.
Table 5. Predictors of overall survival from time of diagnosis–multivariable model.
Number of patients Number of events Hazard Ratio
Age at ALL diagnosis 911 462 1.02
Therapy-related WBC
Cytogenetic Group
NK
Ph+
MLL
Complex Other/Unknown
Sex
Female
Male Phenotype
T
B
HCT (time dependent)
No
Yes
23 0.75 30 0.91
0.36-1.59 0.45 0.49-1.67 0.75 0.02
0.82 -3.31 0.16 1.45-6.45 0.003 0.27-2.30 0.65 0.58-2.36 0.67
15 - -
27 1.65 15 3.06 5 0.78 22 1.17
51 - -
33 1.01 0.55-1.86 0.97
46 - -
38 0.99
0.56-1.73 0.97
95% CI P
1.01-1.03
Denovo 823 412 - -
<0.0001
ALL Disease Type
88 50 911 462
1.32 0.97-1.80 0.08 1.001 1.001-1.002 0.003
273 138 --
<0.0001
251 115 54 28 39 25 294 156
404 188
507 274
115 50 --
796 412
1.46 1.08-1.97 0.02
0.63 0.48-0.82 0.0006 0.83 0.54 -1.29 0.41 1.22 0.79-1.87 0.37 1.19 0.94 -1.50 0.14
- -
1.31 1.09-1.59 0.005
359 169 - -
552 293 1.29 1.04-1.60 0.02
WBC: white blood cell count; NK: normal karyotype; Ph+: Philadelphia chromosome positive; MLL: mixed lineage leukemia; HCT: hematopoietic cell transplantation
haematologica | 2018; 103(10)
1667
