
Page 98 - 2018_10-Haematologica-web
P. 98
I. Aldoss et al.
sex (OR=1.64; 95% CI:1.02-2.65, P=0.04), lower WBC at presentation (OR=0.996; 95%CI:0.99-1.00, P=0.038), and MLL gene rearrangement (OR=6.52; 95%CI:2.66-15.96, P<0.0001) (Table 2).
Characteristics of the t-ALL cohort
The original diagnosis prior to t-ALL onset was solid cancer in 52 (56%) patients, hematological cancer in 33 (35%) patients, combined solid and hematological cancers in 2 (2%) patients, and 6 (6%) patients had non-malignant diseases treated with cytotoxic therapies. Breast cancer was the most common prior diagnosis (n=23, 25%) fol- lowed by lymphoproliferative neoplasms (non-Hodgkin lymphoma, chronic lymphocytic leukemia, Hodgkin’s lymphoma) (n=21, 23%), and multiple myeloma (MM)
(n=11, 12%). Thirty-five (38%) patients had chemothera- py alone as prior therapy for the original diagnosis, 26 (28%) had only radiotherapy, 32 (34%) had a combination of chemotherapy and radiation, 17 (18%) received an autologous hematopoietic cell transplant (HCT) as part of prior therapy, and 13 (14%) had immunomodulatory agents in combination with chemotherapy. Interestingly, 2 cases had antecedent MDS before presenting with t-ALL (Table 3).
Eighty-three percent of t-ALL patients with available conventional cytogenetic and/or FISH studies had cytoge- netic abnormalities. Philadelphia (Ph) chromosome was the most common finding on cytogenetics for the t-ALL cohort, and followed by normal karyotype and mixed lin- eage leukemia (MLL) gene rearrangement. Among 78
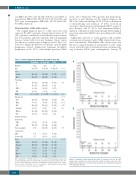
Figure 1. Survival for t-ALL and de novo ALL. A. Survival curves for all t-ALL (dashed line) and de novo ALL (solid line) and B. Survival curves for t-ALL (dashed line) and de novo (solid line) ALL in patients who underwent allogeneic HCT during ALL therapy.
A
B
De novo
Therapy-related
De novo
Therapy-related
Table 1. Overall comparison between t-ALL and de novo ALL.
All patients
Number 1022 Age 39 (6-85) Sex
Female 440 (43)
Male 582 (57) Phenotype
B 870 (85) T 150 (15) ETP# 20(19)
De novo ALL 929
37 (6-85)
387 (42)
542 (58)
785 (85) 142 (15) 19 (19)
2 (<1) 17 (0.2-778)
241 (26) 41 (4) 279 (30) 4 (4) 229 (25) 98 (11)
58 (8) 711 (92) 182 (76)
91 (50) 91 (50)
320 (34) 445 (48) 76 (8) 29(3) 19 (2)
t-ALL
93
55 (23-85)
53 (57)
40 (43)
85 (91)
8 (9)
1 (17)
0 (0)
10 (0.9-330)
29 (31) 16 (17) 17 (18) 5 (5) 21 (23) 5 (5)
13 (16) 68 (84) 22 (76)
16 (73) 6 (27)
48 (52) 27 (29) 10 (11) 2 (2) 3(3)
P
< 0.01
<0.01
0.09
0.10 <0.01 0.27 <0.01 0.017 0.60
0.02
0.07
<0.01
B/T
WBC Cytogenetic
Ph+ MLL
NK Complex Others UK
Ch 5/7q deletion/ monosomy
YES
NO
Ph+ & available cytogenetics ACA
Isolated Ph Race
White Hispanic Asian AA Others UK
2 (<1) 16.3 (0.2-778)
270 (26) 57 (6) 296 (29) 46 (5) 250 (24) 103 (10)
71 (8) 779 (92) 204
107 97
368 (36) 472 (46) 86 (9) 31(3) 222)
43(4) 40(4) 3(3)
ETP: early thymic T cell; WBC: white blood cell count; Ph+: Philadelphia-chromosome positive; MLL: Mixed lineage leukemia; NK: normal karyotype; UK: unknown, Ch: chro- mosome; ACA: additional cytogenetic abnormalities; AA: African American. # There were 108 cases of T-cell ALL (de novo = 102, t-ALL = 6) with available adequate mark- ers upon review to make the diagnosis of ETP.
1664
