
Page 146 - 2018_10-Haematologica-web
P. 146
S. Nikiforow et al.
AB
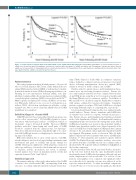
Figure 1. Overall survival for patients with isolated UGI aGvHD versus aGvHD without UGI symptoms. Kaplain-Meier probabilities of overall survival from time of aGvHD onset for patients with iUGI symptoms, and subsets of patients with other grades of aGvHD but without any UGI symptoms. Patients who did not develop aGvHD are not represented. A. Transplantation from a matched-related donor. B. Transplantation from a well-matched or partially-matched unrelated donor. UGI: upper gastrointestinal. aGvHD: acute graft-versus-host disease.
Patient Selection
The study population included all adult patients > 18 years old who received an allogeneic HSCT from a fully human leukocyte antigen (HLA)-matched related (MRD) or well-matched or partial- ly-matched unrelated donor (URD) following myeloablative con- ditioning for acute myelogenous leukemia (AML), acute lym- phoblastic leukemia (ALL), chronic myelogenous leukemia (CML), or myelodysplastic syndrome (MDS) between 2000 and 2012.26,27 Only recipients of peripheral blood stem cell (PBSC) or bone mar- row (BM) grafts, without ex vivo or in vivo T-cell depletion (e.g., without CD34+ cell-selection, anti-thymocyte globulin, or alem- tuzumab use), who received calcineurin inhibitor-based aGvHD prophylaxis were analyzed.
Definition/diagnosis of acute GvHD
CIBMTR form 2100 based on modified Glucksberg criteria, was used to collect outcome data.10 UGI aGvHD is defined as “persis- tent nausea with histological evidence of GvHD in stomach or duodenum” - Stage 1 GI Grade II aGvHD. However, CIBMTR guidance reads that “organ staging and overall grade of GvHD should be calculated from the clinical picture, not histology”. Thus, those with persistent nausea clinically thought to be consis- tent with GvHD and treated accordingly may be classified as hav- ing upper GI aGvHD.
Other data included date of onset of first episode of aGvHD, whether diagnosis was based on biopsy findings, maximum organ involvement and grade of aGvHD, and specific therapy for aGvHD. Histological confirmation of UGI symptoms consisted of endoscopy and biopsy of stomach or duodenum and was reported as “negative, positive, inconclusive, not tested, or missing”. Current analyses were based on maximal reported severity and organ involvement (Table 1 and Table 2).
Statistical approach
The primary endpoint of this study, when analyzed by aGvHD occurrence, was overall survival (OS), encompassing death from any cause. Secondary endpoints included treatment-related mor-
tality (TRM) defined as death while in continuous remission; relapse, defined as a clinical recurrence, progression or persistent disease following transplantation; disease-free survival (DFS), defined as absence of death or relapse; and cGvHD.28
Variables related to patient, disease, and transplantation charac- teristics were reported using descriptive statistics. Patient-, dis- ease-, and treatment-related factors were compared between relat- ed and URD groups, using the χ2 test for categorical variables and the Mann-Whitney test for continuous variables. Probabilities of OS and DFS were calculated using the Kaplan-Meier estimator, with variance estimated by Greenwood’s formula. Cumulative incidence estimates for relapse, TRM and cGvHD were calculated by treating TRM and relapse as competing risks, respectively.29
Cox proportional hazard testing models were applied in multi- variable analyses. Patient-, disease-, transplant-, and aGvHD-relat- ed variables were tested via a stepwise forward-selection proce- dure. Patient-, disease-, and transplant-related variables are detailed in the Online Supplementary Methods. In all multivariable analyses, transplantation time was treated as the starting time point, and all GvHD-related variables were treated as time-dependent variables. Multiple time-dependent variables were defined separately at the onset of aGvHD, based on the highest aGvHD grade that a patient developed. For each patient, only a single time-dependent variable was triggered. Our primary results, as shown in Table 3A, high- lighted comparisons between patients with various aGvHD mani- festations +/- UGI symptoms and excluded recipients without aGvHD. The Kaplan-Meier and cumulative incidence curves were also plotted from time of aGvHD onset. In our secondary results, as shown in Table 3B, recipients without aGvHD were highlighted as the baseline comparator.
Results shown in Tables 3A, 3B, and 4 and P-values referred to in the text were derived from the same multivariable models involving all patient GvHD-related groupings, although only par- ticular comparisons are cited in each table. For each set of com- parisons, demographics were compared, and significant differ- ences that affected a particular outcome were addressed via the respective statistical models. To adjust for multiple comparisons, a 2-sided P-value of <0.01 was used as the significance threshold.
1712
haematologica | 2018; 103(10)
