
Page 147 - 2018_10-Haematologica-web
P. 147
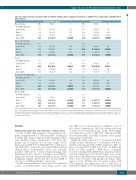
Upper GI acute GvHD adds minimal prognostic value
Table 3B. Clinical outcomes in patients with and without aGvHD: pairwise comparisons between no aGvHD versus isolated UGI or aGvHD without UGI symptoms.
Overall Survival
No aGvHD (Baseline) Isolated UGI
Grade I
Grade II
Grades III/IV
Disease-free Survival
No aGvHD (Baseline) Isolated UGI
Grade I
Grade II
Grades III/IV Relapse
No aGvHD (Baseline) Isolated UGI
Grade I
Grade II
Grades III/IV
Treatment-related Mortality
No aGvHD (Baseline) Isolated UGI
Grade I
Grade II
Grades III/IV Chronic GvHD
No aGvHD (Baseline) Isolated UGI
Grade I
Grade II
Grades III/IV
HR 1.00 1.18 0.92 1.12 2.43
1.00 1.04 0.84 0.97 1.74
1.00 0.93 0.79 0.83 0.88
1.00 1.24 1.03 1.41 4.21
1.00 1.36 1.58 1.65 1.47
Matched Related Donor
95% CI
0.85-1.63 0.80-1.06 0.96-1.31 2.14-2.76
0.77-1.41
0.74-0.96
0.84-1.13
1.54-1.96
0.66-1.33
0.67-0.92
0.68-1.00
0.73-1.06
0.69-2.24
0.81-1.31
1.10-1.81
3.51-5.05
0.97-1.9
1.37-1.83
1.41-1.93
1.25-1.75
P
0.33 0.25 0.16 <0.0001
0.78
0.011
0.71
<0.0001
0.70
0.0032
0.048
0.18
0.48
0.81
0.0074
<0.0001
0.08
<0.0001
<0.0001
<0.0001
Unrelated Donor
HR 95% CI 1.00
1.01 0.79-1.29 0.89 0.79-1.02 1.13 1.00-1.27
2.30 2.07-2.55
1.00
1.09 0.86-1.38
0.80 0.71-0.91
1.03 0.91-1.15
1.81 1.63-2.01
1.00
1.04 0.79-1.37
0.77 0.66-0.90
0.89 0.76-1.03 0.90 0.77-1.05
1.00
0.85 0.54-1.34 0.80 0.65-0.98 1.21 1.01-1.46
3.33 2.87-3.86
1.00 0.95
1.31 1.14-1.51
1.5 1.30-1.72
1.59 1.37-1.84
P
0.94 0.088 0.046 <0.0001
0.48
0.0006
0.68
<0.0001
0.78
0.0011
0.12 0.19
0.49
0.033
0.038
<0.0001
0.69
0.0002
<0.0001
<0.0001
Bold values indicate significance at P-value
time of transplantation as the starting point
3A, patients with isolated UGI GvHD were set as the baseline comparator (HR =1.00). In Table 3B, patients without aGvHD were set as the baseline comparator (HR =1.00). Covariates, including those with significant impacts on transplant-related outcomes can be found in Online Supplementary Table S2. UGI: upper gastrointestinal. aGvHD: acute graft-versus-host disease.
Results
Patient characteristics and outcomes – entire cohort
A total of 8567 adult recipients of myeloablative allo- geneic transplant with a T cell-replete PBSC or BM graft for AML, ALL, CML or MDS from 251 transplant centers were analyzed (Online Supplementary Table S1A). The median age of recipients was 42 years (range, 18-72). Indications for HSCT were AML/MDS (60%), ALL (21%), and CML (18%). Stem cells were from 6/6 HLA-matched siblings (49%), “well-matched” (38%), and “partially- matched” URDs (13%).26 Donor/recipient pairings were female/male in 20%, and 71% of patients received PBSCs. All patients received a calcineurin inhibitor-based aGvHD prophylaxis regimen. Eleven and 12% received MMF or steroids for aGvHD prophylaxis, respectively.
For the entire population, 1-year survival was estimated at 62%, 1-year DFS at 52%, 1-year relapse at 29%, 100-
day TRM at 11%, and incidence of cGvHD at 1 year at 43% (Online Supplementary Table S1B). Median follow-up of survivors was 71 months (range, 1-173). Given signifi- cant differences in rates of OS, DFS, TRM and cGvHD seen between MRD and URD recipients, these groups were analyzed separately.
Within the entire cohort, 2.7% of recipients had iUGI aGvHD (n=229). Overall 12.1% of recipients were docu- mented as having any UGI aGvHD symptoms (Table 1). Rates of Grades II-IV aGvHD were 35.6% for MRD and 52.6% for URD recipients. Only 21.3% of patients recorded as having iUGI aGvHD had confirmation with a gastrointestinal biopsy; 42 of the 49 biopsies were consis- tent with aGvHD. Of patients with any UGI involvement, 38.0% were recorded as undergoing a GI biopsy, either upper or lower. Overall, rates of biopsies in those with UGI symptoms were higher than rates of skin, liver, or LGI biopsies. Only 11% of the 1904 patients biopsied had
<0.01.Italicized values indicate 0.1< P-value <0.05.N.B.,Tables 3A,3B,and 4 were derived from the same multivariable model treating and each GvHD-related group as a time-dependent variable, although only particular comparisons are cited in each table. In Table
haematologica | 2018; 103(10)
1713
