
Page 95 - 2018_09-Mondo
P. 95
Improving T-ALL sensitivity to parthenolide
C
A
B
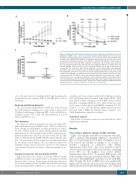
Figure 1. Parthenolide (PTL) induces changes in reactive oxygen species (ROS) and reduced glutathione (rGSH) levels can be reversed by N-acetyl cysteine (NAC). (A) T-cell acute lym- phoblastic leukemia (T-ALL) samples (patients 1, 3, 5, and 9) were pre-incubated with the ROS sensitive probe CMH2DCFDA and ROS accumulation was measured in live cells over 90 min- utes by flow cytometry in response to 10 μM PTL or with PTL+15 mM NAC. Fold change in median fluorescence intensity (MFI) compared to untreated cells is shown; data represent mean ± Standard Deviation (SD). Asterisks represent significant differences between PTL and PTL+15 mM NAC. (B) Dose response curve of patient samples 2, 5, 8, and 10 that had been treated with PTL only (1-10 μM), PTL+30 μM NAC, or PTL+15mM NAC; data represent mean±SD. Top row of asterisks represent significant differences between PTL alone versus PTL+15mM NAC; bottom row of asterisks represent significant differences between PTL alone versus PTL+30 μM NAC. (C) GSH levels were measured in T-ALL samples (patients 1-9) after treatment with PTL (10 μM) for 1 hour and compared with those in untreated cells. Symbols represent the mean % change from untreated cells in replicate samples. Each symbol repre- sents an individual patient (see Online Supplementary Figure S1 for patient symbol key). Lines represent median and interquartile range. Results were analyzed by two-way ANOVA (A and B) or paired t-test (C). *P≤0.05, **P≤0.01, ***P≤0.001, ****P≤0.0001.
over a 90 min period by staining with PI and measuring the median fluorescence intensity (MFI) of the ROS probe by flow cytometry.
Reduced glutathione detection
The level of reduced glutathione (rGSH) was detected using the GSH/GSSG-Glo luminescence assay using a plate reader (GloMax, both Promega, Chilworth, UK). Levels of rGSH were quantified in 2x10⁴ live T-ALL cells either untreated or treated with 10 μM PTL for 1 h.
The thiol concentration in media was detected using a 5,5′- dithiobis-(2-nitrobenzoic) (DTNB) assay. MSC were plated at 5x10⁴ cells/mL per well in MSC medium and allowed to adhere for 24 h. MSC medium was replaced with suspension medium and left for 24 h. Subsequently, 25 μL of MSC conditioned sus- pension medium was removed and mixed with 100 μL TRIS buffer (0.1M) and 25 μL DTNB (2.5mM, Sigma-Aldrich) solu- tion. The reaction was left for 10 min at room temperature, then the absorbance read at 412nm. The concentration of thiols was quantified using a linear regression equation of the standard curve generated from the absorbance of known standards of cys- teine.
Cysteine transporter, xCT, knockdown in MSC
Higher thiol levels are a feature of cysteine, which is usually synthesized using a specialized amino acid transport system, known as the xc- system. To investigate whether knockdown of the cysteine transporter, xCT, in MSC affected thiol production small interfering RNAs (siRNAs) for xCT and a non-coding
scramble control were transfected into MSC with Lipofectamine 3000 (all Thermo Fisher Scientific) using 20nM siRNA. MSC were plated at 5x10⁴ cells/mL per well in MSC media, without Pen/Strep, containing siRNA for 24 h. MSC media was com- pletely removed and replaced with DMEM containing 10% FCS for 24 h. To assess xCT knockdown, mRNA and protein were harvested using a PARIS kit (Thermo Fisher Scientific). (See Online Supplementary Appendix for details.)
Statistical analysis
Full details of statistical analyses are provided in the Online Supplementary Appendix.
Results
Cytotoxicity is linked to changes in ROS and GSH
Eight of 10 samples responded to treatment with PTL, with a median half-maximal inhibitory concentration (IC50) of 7.6 μM (range 2.6-10.0 μM). The highest dose of PTL reduced the viability of samples to an average of 30±18% compared to untreated cells (Online Supplementary Figure S2A). Two cases (patients 3 and 9) were relatively resistant to PTL with viabilities remaining above 55% at the highest dose tested (Online Supplementary Figure S2B). To measure ROS levels, cells from 4 samples were pre-incubated with the ROS sensi- tive probe CM H2DCFDA and then treated with PTL. After 30 min, the level of ROS stress was significantly higher in PTL treated cells and it was 5-fold higher than untreated cells after 90 min (P≤0.02) (Figure 1A). Addition
Thiol detection
haematologica | 2018; 103(9)
1495
