
Page 84 - Haematologica August 2018
P. 84
D. Salvatore et al.
the Haplo group there was a higher proportion of high- risk AML (34% versus 24% in MSD, P<0.01), bone mar- row (BM) as stem cell source (50% versus 19% in MSD; P<0.01) and CMV positive donors (72% versus 62% in MSD; P<0.01). Conditioning regimen was MAC in approximately 50% of cases in both Haplo and MSD (P=0.52). In the Haplo group, the most frequently used MAC contained Thiotepa-Busulfan-Fludarabine, while the most frequent RIC contained cyclophosphamide and 2 or 4 Gy TBI. In the MSD group, the most frequently used MAC and RIC regimen were Busulfan- Cyclophosphamide and Busulfan-Fludarabine, respective- ly. Details on conditioning regimens are reported in the Online Supplementary Table. Among Haplo recipients, 137 (74%) received PTCY and 54 (31%) received ATG as GvHD prophylaxis.
Univariate analysis for the whole population
The results of univariate analysis are summarized in Table 2A. A higher engraftment rate was observed in MSD recipients (99% versus 96%, P<0.01), with a shorter median time to engraftment in this group (16 versus 18 days in Haplo, P<0.01)
Higher incidence of grade II-IV aGvHD was found in Haplo (21% versus 31%, P<0.01) while cGvHD was lower as compared to MSD (33% versus 35%, P=0.05). Main causes of death were disease recurrence (in 30% versus 59%), GvHD in 16% versus 18% and infections in 33% versus 12% of Haplo and MSD, respectively.
At 2 years, CI of relapse was 19% versus 24% (P=0.10) and NRM was 23% versus 10% (P<0.01) in Haplo and MSD recipients, respectively. The probability of LFS and OS were 58% versus 67% (P<0.01) and 68% versus 76% (P<0.01), in Haplo and MSD, respectively. Probability of GRFS was 47% versus 50% (P=0.25), respectively.
Multivariate analysis for the whole population
In a multivariate analysis adjusted on the main differ-
ences between the two groups (Table 3A), Haplo was associated with a higher risk of grade II-IV aGvHD (HR=1.94; 95% CI: 1.38-2.73; P<0.01), a higher NRM (HR=2.56; 95% CI:1.73-3.77; P<0.01), a lower LFS (HR=1.33; 95% CI: 1.03-1.71; P<0.04) and a lower OS (HR=1.34; 95% CI: 1.03-1.75; P<0.04).
Moreover, due to a significant interaction between donor type and cytogenetic risk on LFS (P<0.01), all fur- ther analyses were stratified on cytogenetic group.
Outcomes according to cytogenetics: intermediate and high-risk AML
Intermediate risk AML
The results of univariate analysis in this group are sum- marized in Table 2B. Grade II-IV aGvHD was 29% versus 20% (P<0.03) for Haplo and MSD recipients, respectively. At 2 years, CI of cGvHD was 30% versus 36% (P<0.02) for Haplo and MSD recipients, respectively. The probability of LFS and OS were 56 % versus 70% (P<0.01) and 68% versus 79% (P<0.01) in Haplo and MSD, respectively. Probability of GRFS was 45% versus 54% (P<0.05), in Haplo and MSD, respectively. CI of relapse was 18% ver- sus 20% (P=0.52) and NRM was 26% versus 10% (P<0.01) in Haplo and MSD recipients, respectively.
In multivariate analysis, Haplo was associated with a higher risk of grade II-IV aGvHD (HR 1.84; 95% CI 1.20- 2.82; P<0.01), higher NRM (HR 3.03; 95% CI 1.98-4.62; P<0.01), lower LFS (HR 1.74; 95% CI 1.30-2.32; P<0.01), OS (HR 1.80; 95% CI 1.32-2.45; P<0.01) and GRFS (HR 1.32; 95% CI 1.01-1.72; P<0.05). No significant differences were found for cGvHD and RI. Results of multivariate analysis for donor type and other factors associated with the main outcomes are reported in table 3B.
High risk AML
The results of univariate analysis are summarized in table 2C For Haplo and MSD recipients, grade II-IV aGvHD was 36% versus 24% (P<0.04) and cGvHD was
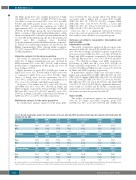
Table 2. Results of univariate analysis for main outcomes at 2 years after allo-HSCT according to donor type (A) in patients with intermediate (B) and high risk (C) AML.
A) Outcome RI % ±s.d.
Haplo 19±6
MSD 24±2 P 0.10 B) Outcome RI %
±s.d.
Haplo 18±7
MSD 20±3 P 0.52 C) 2-years outcome RI%
±s.d
Haplo 21±9
MSD 36±4
P <0.02
NRM % ±s.d.
23±6
10±2
<0.01
NRM % ±s.d.
26±8
10±2
<0.01
NRM% ±s.d
18±9
10±3
0.16
LFS % OS % Gr. II-IV aGvHD % cGvHD% GRFS% ±s.d. ±s.d. ±s.d. ±s.d. ±s.d.
58±6 68±6 31±7 33±6 47±8
67±4 76±2 21±2 35±2 50±2
<0.01 <0.01 <0.01 0.05 0.25
LFS % OS % Gr. II-IV aGvHD % cGvHD% GRFS% ±s.d. ±s.d. ±s.d. ±s.d. ±s.d.
56±9 68±8 29±8 30±9 45±9
70±2 79±2 20±2 36±2 54±2
<0.01
LFS% ±s.d
61±13
55±4
0.14
<0.01
OS % ±s.d
67±12
66±4
0.26
<0.03
aGvHD gr II-IV % ±s.d
36±12
24±3
<0.04
<0.02
cGvHD % ±s.d
39±12
33±4
0.79
<0.05
GRFS % ±s.d
49±13
40±4
0.17
1320
RI: relapse incidence; s.d.: standard deviation; NRM: non-relapse mortality; LFS: leukemia-free survival; OS: overall survival; GRFS: refined graft-versus-host disease/relapse free survival; aGvHD: acute graft-versus-host disease; cGvHD: chronic-graft-versus host disease; Haplo: haploidentical donor; MSD: matched sibling donor.
haematologica | 2018; 103(8)
