
Page 35 - Haematologica August 2018
P. 35
CARD10 regulates granulocytic differentiation
Short hairpin RNA (shRNA) interference
To obtain Card10 knock-down in NB4 cells and murine progen- itor cells, human and murine Card10 shRNA were cloned in the pLKO.1 lentiviral vector. Briefly, for virus production, 293T cells were seeded in a 100mm dish, one day before transfection in DMEM medium supplemented with 10% FBS. Plasmid DNA (either non-target shRNA or Card10 shRNA) was transfected along with pCMV-dr8.2 and pMD2.G using Lipofectamine 2000 transfection reagent (Invitrogen, Carlsbad, CA, USA). After 4 hours, the transfection medium was replaced with DMEM medi- um supplemented with 10% FBS. Cell culture supernatants con- taining the lentivirus were collected at 48 h and 72 h post-transfec- tion. Cells were transduced with lentiviral particles in the presence of 8 μg/ml polybrene (Sigma-Aldrich) for 24h. Transduced cells were selected with puromycin (1 μg/ml for NB4 and 2 μg/ml for mouse Lin–Kit+ BM cells) for a week.
RNA isolation, cDNA conversion and QPCR
RNA from sorted murine granulocytes, progenitor populations or NB4 cells was isolated using either RNeasy Micro or Mini Kit (Qiagen) depending on the number of cells. cDNA was prepared using MuLV Reverse Transcriptase (Thermo Fisher Scientific). Primer sequences used for quantitative RT-PCR are listed in Online Supplementary Table S1.
RNA sequencing and expression analysis
cDNA libraries were prepared from poly-A selected RNA using Truseq RNA sample kit (Illumina). Libraries were sequenced on HiSeq 4000 and 100 bp paired-end reads were aligned to murine reference transcriptome (GRCm38/mm10; Ensemble version 84) using Kallisto (version 0.43.0). Transcript level fragment counts were summarized at the gene level using TxImport Bioconductor package, and differential analysis was performed using DESeq2. Gene expression was quantified in FPKM units using DESeq2 FPKM command and was used for all downstream analysis and plotting. All other test-statistics and plotting were performed using R 3.4.0. Gene Ontology (GO) was performed on differentially expressed genes using goseq Bioconductor package (version 1.20.0), which accounts for bias due to gene length. Resulting P-values were adjusted for False Discovery Rate (FDR). For GSEA analysis, we used all “active transcripts” with mean expression of 0.5 FPKM to identify significantly enriched gene sets among MSigDB C2 gene sets.
Statistical analysis
Two-sided, unpaired Student t-test was used to determine the statistical significance of experimental results. Data represented as mean ± SD. P values <0.05 are considered statistically signifi- cant.
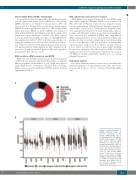
A
B
Figure 1. Characterization of CEBPE ChIP-Seq peaks. (A) Genomic annotation of the 40,517 CEBPE binding sites to the murine genome according to known RefSeq genes. (B) Box plots depict ChIP-seq signal intensities for histone marks in multiple hematopoietic cells22 for the 312 genes downregulated in Cebpe KO immature granulo- cytes. Histone marks were meas- ured +/- 1kb around CEBPE peaks. Peaks were classified based on the location of CEBPE binding. (i) Promoter peak (+1kb to -100bp) (ii) Intronic peak (iii) Intergenic peak within 10kb of the TSS (iv) Intergenic peak beyond 10kb of the TSS.
haematologica | 2018; 103(8)
1271
