
Page 149 - Haematologica August 2018
P. 149
End-of-life care for myeloma
fact that the hospice model is known to be especially effective in pain management may promote increased enrollment. Additionally, the known incurability of myeloma may temper prognostic uncertainty and encour- age earlier EOL discussions compared to blood cancers that are potentially curable.32
The current analysis allowed us to explore potential unique barriers to timely enrollment, such as transfusion-
and dialysis-dependence. Our finding that patients who were transfusion-dependent had three times the odds of enrolling late is provocative, and suggests that transfusion- dependence is not only associated with lack of hospice use for patients with blood cancers,20,22 but also impacts the timeliness of enrollment. Although transfusions are pallia- tive, only very few hospices in the USA provide this resource due to reimbursement constraints.33 In some
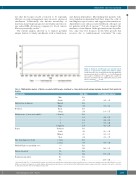
Figure 2. Trends in overall hospice use and late enroll- ment (≤ 3 days before death) from 2000 to 2013. Trends in hospice use for myeloma decedents significatly increased from 2000 to 2013 (Ptrend <0.001).Trends in late hospice enrollment (≤ 3 days before death) for myeloma decedents did not significantly increase from 2000 to 2013 (Ptrend =0.19).
Table 3. Multivariable analysis of factors associated with hospice enrollment ≤ 3 days before death among myeloma decedents that enrolled in hospice.
Characteristic
Sex
Marital status at diagnosis
Residency
Median income (census tract quintile)
Region
Time from diagnosis to death
Modified Charlson comorbidity score
Dialysis-dependent
Transfusion-dependent
Male Female Married Other Rural Urban
1 (lowest) 2
3
4
5 (highest) Northeast South Midwest West
< 1 year ≥1year 0-1
2+
No Yes
No
Yes
Odds Ratio
Ref
0.75
Ref
0.88
Ref
1.34
Ref
1.06
1.06
1.00
1.04
Ref
0.49
0.80
0.64
Ref
0.76
Ref
1.41
Ref
2.22
Ref
3.02
95% Confidence Interval
0.64 – 0.86
0.76 – 1.02
1.03 – 1.75
0.84 – 1.35 0.84 – 1.33 0.76 – 1.24 0.81 – 1.34
0.40 – 0.62 0.63 – 1.01 0.53 – 0.77
0.66 – 0.87
1.22 – 1.65
1.79 – 2.76
2.39 – 3.82
Only variables with P <0.05 in univariable analysis, specifically sex, marital status, urban/rural residency, median income census tract quintile, region, modified Charlson comor- bidity score, time from diagnosis to death, dialysis, and transfusion-dependence, were included in the multivariable logistic regression model to generate odds ratios. Odds ratio >1 indicate increased odds of enrolling in hospice late .
haematologica | 2018; 103(8)
1385
