
Page 147 - Haematologica August 2018
P. 147
End-of-life care for myeloma
able model that assessed the relationship between hospice use and aggressive EOL care, patients who enrolled in hos- pice were significantly less likely to experience any meas- ure of aggressive care at the EOL (OR 0.20, 95% CI 0.18 – 0.22). There was also a slight decrease in experiencing any aggressive EOL care during the study period (59.2% in 2000 to 56.7% in 2013, Ptrend=0.01).
Discussion
In this large cohort of older patients with myeloma, almost half enrolled in hospice, and among these, approx-
imately 17% enrolled within 3 days of death. Although hospice enrollment significantly increased between 2000 and 2013, with rates almost doubling, there was no signif- icant rise in late enrollment, suggesting that the increase in hospice use was meaningful. While slightly more than half of the myeloma decedents experienced at least one indica- tor of medically aggressive care in the last month of life, there was a significant decline in the overall intensity of healthcare utilization during the study period. Moreover, patients who enrolled in a hospice had substantially lower odds of experiencing medically aggressive care at the end of life. Taken together, these data suggest improvements in EOL care for patients with myeloma, which could be
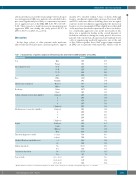
Table 1. Characteristics of patients diagnosed with myeloma who died between 2000 and 2013 (n=12,686).
Characteristic
Sex
Age at diagnosis (yrs)
Race
Marital status at diagnosis
Residency
College education (census tract quintile)
Median income (census tract quintile)
Region
Time from diagnosis to death*
Modified Charlson comorbidity score
Dialysis-dependent
Transfusion-dependent
Year of death
Number %
Male 6275 49.5 Female 6411 50.5 65-69 2215 17.5 70-74 2727 21.5 75- 79 2862 22.5 ≥80 4882 38.5 White 10225 80.6 Nonwhite 2461 19.4 Married 6390 50.4 Other 6296 49.6
Urban Rural
1 (lowest) 2
3
4
5 (highest) 1 (lowest) 2
3
4
5 (highest) Northeast South Midwest West
<1year ≥ 1year
0-1
2+
No Yes
No Yes 2000 – 2003 2004 – 2008
2009 – 2013
11271 88.9 1413 11.1 2471 19.5 2463 19.4 2796 22.0 2477 19.5 2479 19.6 2459 19.4 2472 19.5 2796 22.0 2478 19.5 2481 19.6 2629 20.7 3426 27.0 1695 13.4 4936 38.9 5198 41.0 7488 59.0 4240 33.4 8446 66.6
11,350 89.5 1336 10.5 11,759 92.7 927 7.3 2407 19.0 5047 39.8
5232 41.2
*Median duration of disease (from myeloma diagnosis to death) in the cohort was 17.6 months (interquartile range 5.2 to 39.1 months).
haematologica | 2018; 103(8)
1383
