
Page 148 - Haematologica August 2018
P. 148
O.O. Odejide et al.
further augmented by promoting timely hospice use.
The rise in hospice use among myeloma decedents is consistent with prior studies among patients with various malignancies in the USA.16,22,27 Such trends may reflect a greater awareness of the benefits of hospice care, especial- ly as professional oncology organizations have released statements on the importance of hospice.28,29 Moreover, there has also been a substantial growth in the number of hospice organizations serving various locations in the USA over the past two decades.30 Unlike many other
hematologic cancers,21,22 gains in hospice use for patients with myeloma were not accompanied by increases in late enrollment. Distinct features of myeloma compared to other blood cancers, such as incurability and a high preva- lence of pain, may make the need for hospice services at the EOL clearer and thus encourage timely enrollment. Indeed, in a prior study examining symptom burden of patients with hematologic malignancies, those with myeloma had the highest number and severity of symp- toms, such as pain, fatigue, and constipation.31 A combina- tion of this population’s severe symptom burden and the
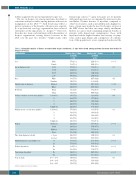
Table 2. Univariable analysis of factors associated with hospice enrollment ≤ 3 days before death among myeloma decedents that enrolled in hospice (n=6111).
Characteristic
Sex
Age at diagnosis (yrs)
Race
Marital status at diagnosis
Residency
College education (census tract quintile)
Median income (census tract quintile)
Region
Time from diagnosis to death
Modified Charlson comorbidity score
Dialysis-dependent
Transfusion-dependent
Year of death
Hospice stay ≤ 3 days (n=1054)
n (%)
Hospice stay > 3 days P (n=5057)
Male Female 65- 69 70-74 75- 79 ≥80 White Nonwhite Married Other Rural Urban
1 (lowest) 2
3
4
5 (highest) 1 (lowest) 2
3
4
5 (highest) Northeast South Midwest West <1year ≥1year 0-1
2+
No Yes
No Yes 2000 – 2003 2004 – 2008 2009 – 2013
551 (20.0) 503 (15.0) 177 (19.0) 234 (19.1) 227 (16.6) 416 (16.1) 906 (17.6) 148 (15.6) 572 (18.8) 482 (15.7) 82 (12.7) 972 (17.8) 166 (15.2) 202 (17.1) 243 (17.6) 221 (17.9) 222 (18.1) 156 (14.6) 196 (16.6) 252 (17.4) 210 (17.5) 240 (19.9) 272 (23.7) 228 (12.9) 184 (19.6) 370 (16.4) 426 (18.7) 628 (16.4) 301 (13.1) 753 (19.8) 904 (16.0) 150 (32.3) 922 (16.0) 132 (36.5) 147 (15.7) 396 (17.2) 511 (17.8)
n (%)
2214 (80.0) 2843 (85.0)
<0.001
754 (81.0) 0.05
993 (80.9)
1142 (83.4)
2168 (83.9)
4255 (82.4) 0.14 802 (84.4)
2470 (81.2)
2587 (84.3) 562 (87.3) 4494 (82.2)
0.0014
0.0013
929 (84.8) 0.34
977 (82.9) 1137 (82.4) 1012 (82.1) 1002 (81.9)
911 (85.4) 0.02 988 (83.4)
1199 (82.6) 993 (82.5) 966 (80.1) 876 (76.3) 1543 (87.1) 757 (80.4) 1881 (83.6)
<0.001
1848 (81.3) 0.02 3209 (83.6)
2001 (86.9)
3056 (80.2) 4743 (84.0) 314 (67.7) 4827 (84.0) 230 (63.5)
<0.001
<0.001
<0.001
1384
788 (84.3) 0.33 1913 (82.8)
2356 (82.2)
All percentages are row percentages.
haematologica | 2018; 103(8)
