
Page 104 - Haematologica August 2018
P. 104
C. Melani et al.
[Figure 3]. Furthermore, there was no difference in tumor reduction when comparing patients with (N=6) and with- out (N=83) treatment failure; median reduction of 92% (range, 65-99) vs. 93% (range, 62-100), respectively [Figure 3].
Serial FDG-PET Scans
Fifty-seven of 80 patients with evaluable EOT FDG-PET scans underwent 144 total serial scans; median of 2 (range, 1-6). Among the 54 patients with a negative EOT FDG- PET who are progression-free, 34 had serial scans. Linear regression analysis demonstrated an overall decrease in SUVmax over time with a median change per day in SUVmax of -0.005 (range, -0.134-0.010; P=0.0018) [Online Supplementary Figure S1A]. Among the 20 patients with a positive EOT FDG-PET who are progression-free, 17 had serial scans. SUVmax decreased in these patients as well with linear regression analysis revealing a median change per day in SUVmax of -0.006 (range, -0.070-0.002; P=0.0005) [Figure 4A].
In the 6 treatment failures, the median EOT FDG-PET SUVmax was 15.4 (range, 1.9-21.3) [Figure 4C]. All 6 treat- ment failures had evidence of disease, which was docu- mented by biopsy in 4 and by standard imaging criteria in 2 patients. One patient without biopsy confirmation
showed progression on CT with an EOT SUVmax of 14.5 and received salvage radiotherapy. A second patient with- out biopsy showed progression on treatment with increases in SUVmax from 10.2 to 21.3, and appearance of a new lesion, and received radiotherapy. Serial scans in 5 treatment failures all revealed progressive increases in SUVmax, which normalized in 3 patients following radio- therapy, resection, and chemotherapy/transplantation/ radiotherapy, respectively. Two patients had continued progression of SUVmax despite multiple salvage therapies and both died of progressive disease. Linear regression analysis in the 5 treatment failures with serial scans showed an overall increase in SUVmax per day across seri- al scans, with a median of 0.023 (range, -0.007-0.267; P=0.13), which was statistically greater than both positive and negative EOT FDG-PET non-progressors (P=0.011 and P=0.0037, respectively).
Among 51 non-progressing patients with serial scans, 10 (20%) continued to have positive and 29 (57%) continued to have negative Deauville scores. Seven (14%) patients converted from positive to negative and 5 (10%) convert- ed from negative to positive [Figure 4B; Online Supplementary Figure S1B]. In the 5 patients with treat- ment failure and serial scans, Deauville score remained stable in 4 (80%) and increased in 1 (20%) [Figure 4D].
AB
C
D
P=0.71
P=0.30
1340
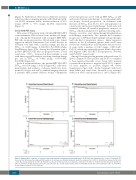
Figure 1. Kaplan–Meier estimates of event-free and overall survival of all patients and by study group. DA-EPOCH-R was administered to a total of 93 patients; 59 treated on the NCI prospective study and 34 treated on the retrospective Stanford study. (A). Event-free survival 90.6% (95% CI, 81.8-95.2) at 8-years for the total cohort. (B). Overall survival 94.7% (95% CI, 86.3-98.0) at 8-years for the total cohort. (C). Event-free survival 90.6% (95% CI, 78.8-96.0) for the NCI cohort and 91.0% (95% CI, 74.6-97.0) for the Stanford cohort (P=0.71) at 8-years. (D). Overall survival 95.6% (95% CI, 83.5-98.8) for the NCI cohort and 93.8% (95% CI, 77.5-98.4) for the Stanford cohort (P=0.30) at 8-years.
haematologica | 2018; 103(8)
