
Page 103 - Haematologica August 2018
P. 103
Serial FDG-PET Imaging in PMBCL
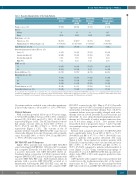
Table 1. Baseline Characteristics of the Study Patients. Characteristic
Female sex- no. (%)
Age- yr.
Median
Range
Bulky tumor, > 10 cm
Patients- no. (%)
Maximal diameter- Median (Range), cm Stage IV disease- no. (%)
International prognostic index (IPI)- no. (%)
Low (0-1) Low-intermediate (2) Intermediate-high (3) High (4-5)
ECOG- no. (%)
0-1
2-3
Elevated LDH- no. (%) Extranodal site- no. (%)
0-1 ≥2 Any
Pleural effusion- no. (%)
Pericardial effusion- no. (%)
Total Cohort (N=93)
55 (59)
31
18-68
54 (59)a 10.7 (4-18.9) 18 (19)
60 (65) 22 (24) 8 (9)
Evaluable EOT FDG-PET (N=80)
44 (55)
31
18-68
52 (66)b,d 10.9 (5.5-18.9)e 14 (18)
53 (66) 18 (23) 7 (9)
Prospective NCI Cohort (N=59)
35 (59)
30
19-54
36 (61) 10.9 (4-18.9) 14 (24)
37 (63) 15 (25) 6 (10)
Retrospective Stanford Cohort (N=34)
20 (59)
32.5
18-68
18 (55)c 10 (4.9-18.3) 4 (12)
23 (68) 7 (21) 2 (6)
3(3) 2(3) 1(2) 2(6)
81 (87)
12 (13) 68 (74)a
80 (86) 13 (14) 38 (41) 45 (48)
38 (41)
69 (86)
11 (14) 59 (75)b
69 (86)
11 (14)
30 (38)
40 (50)
35 (44)
57 (97)
2 (3)f 46 (78)
50 (85)
9 (15)
27 (46)
27 (46)
21 (36)
24 (71)
10 (29) 22 (65)c
30 (88)
4 (12)
11 (32)
18 (53)
17 (50)
aN = 92 patients; bN = 79 patients; cN = 33 patients; dP=0.0013 comparing patients with and without evaluable EOT FDG-PET scans; eP= 0.0009 comparing patients with and without evaluable EOT FDG-PET scans; fP=0.00058 comparing patients treated at NCI vs. Stanford; ECOG: Eastern Cooperative Oncology Group performance status; LDH: lactate dehy- drogenase; EOT FDG-PE: end-of-treatment; 18F-fluorodeoxyglucose-positron-emission tomography; NCI: National Cancer Institute.
13 patients without evaluable scans other than significant- ly more bulky tumors > 10 cm (66% vs. 15%, P=0.0013).
Clinical Outcome
With a median potential follow up of 8.4 years (range, 1.7-18.4), EFS and OS at 8-years is 90.6% (95% confidence interval [CI]; 81.8-95.2) and 94.7% (95% CI; 86.3-98.0), respectively [Figure 1 A-B]. The NCI and Stanford cohorts had similar outcome with an 8-year EFS of 90.6% vs. 91.0% (P=0.71) and OS of 95.6% vs. 93.8% (P=0.30), respectively [Figure 1 C-D]. The outcome of the 13 patients without evaluable EOT FDG-PET scans was not statistically different from the 80 patients with evaluable scans; 8-year EFS 100% vs. 89.0% (P=0.17) and OS 100% vs. 93.8% (P=0.24), respectively.
EOT FDG-PET and CT Response
Eighty (86%) patients had evaluable EOT FDG-PET scans following DA-EPOCH-R. Fifty-five (69%) patients had a negative (Deauville 1-3) and 25 (31%) patients had a positive (Deauville 4-5) EOT FDG-PET [Table 2]. Treatment failure occurred in 1 of 55 (2%) patients with a negative EOT FDG-PET and in 5 of 25 (20%) patients with a positive EOT FDG-PET scan. All 5 treatment failures in patients with a positive EOT FDG-PET occurred at or immediately following the EOT FDG-PET scan, and the one treatment failure in the patient with a negative EOT
FDG-PET occurred at day 320. One of 17 (6%) Deauville 4 patients and 4 of 8 (50%) Deauville 5 patients had treat- ment failure following front-line therapy. Four of 6 (67%) treatment failures were successfully salvaged with radio- therapy alone in 2 (both Deauville 5), resection alone in 1 (Deauville 4), and chemotherapy/transplantation/radio- therapy in 1 (Deauville 2) with a median remission dura- tion of 6.4 years (range, 2-11.3). Two patients (both Deauville 5) died of progressive disease 7 and 17 months after multiple salvage regimens and 2 patients died with- out disease.
Patients with a negative (Deauville 1-3) EOT FDG-PET had a significantly better 8-year EFS of 96.0% vs. 71.1% (P=0.0010) and OS of 97.7% vs. 84.3% (P=0.0115) com- pared to patients with positive (Deauville 4-5) scans [Figure 2 A-B]. In an exploratory analysis, patients with Deauville 5 scans had the poorest outcome with an 8-year EFS of 50% vs. 93.3% (P=0.0003) and OS of 75% vs. 95.9% (P=0.029) compared to patients with Deauville 1-4 scans [Figure 2 C-D]. Using conventional groupings of Deauville 1-3 versus 4-5, EOT FDG-PET had a positive pre- dictive value (PPV) of 20% and a negative predictive value (NPV) of 98%.
All 89 patients with complete tumor measurements had a reduction in the bi-dimensional product of the largest tumor mass by CT. There was no relationship between EOT tumor reduction and EOT FDG-PET Deauville score
haematologica | 2018; 103(8)
1339
