
Page 145 - Haematologica Vol. 109 - July 2024
P. 145
ARTICLE - Patterns of lower risk MDS progresion
22 months.
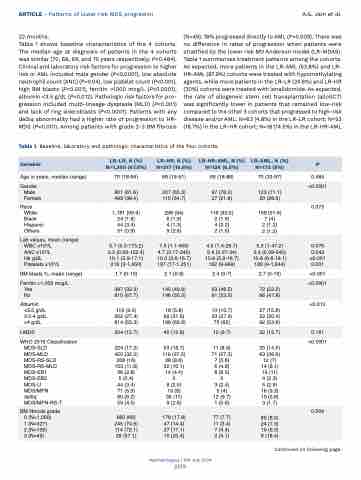
Table 1 shows baseline characteristics of the 4 cohorts. The median age at diagnosis of patients in the 4 cohorts was similar (70, 68, 69, and 70 years respectively; P=0.484). Clinical and laboratory risk factors for progression to higher risk or AML included male gender (P<0.0001), low absolute neutrophil count (ANC) (P=0.04), low platelet count (P<0.001), high BM blasts (P<0.001), ferritin >1000 mcg/L (P<0.0001), albumin <3.5 g/dL (P=0.012). Pathologic risk factors for pro- gression included multi-lineage dysplasia (MLD) (P<0.001) and lack of ring sideroblasts (P<0.0001). Patients with any del5q abnormality had a higher rate of progression to HR- MDS (P=0.001). Among patients with grade 2-3 BM fibrosis
A.G. Jain et al. (N=49), 18% progressed directly to AML (P=0.009). There was
no difference in rates of progression when patients were stratified by the lower risk MD Anderson model (LR-MDAS). Table 1 summarizes treatment patterns among the cohorts. As expected, more patients in the LR-AML (53.8%) and LR- HR-AML (87.9%) cohorts were treated with hypomethylating agents, while more patients in the LR-LR (24.6%) and LR-HR (30%) cohorts were treated with lenalidomide. As expected, the rate of allogeneic stem cell transplantation (alloSCT) was significantly lower in patients that remained low-risk compared to the other 3 cohorts that progressed to high-risk disease and/or AML: N=63 (4.8%) in the LR-LR cohort; N=53 (16.7%) in the LR-HR cohort; N=18 (14.5%) in the LR-HR-AML
Table 1. Baseline, laboratory and pathologic characteristics of the four cohorts.
Variable
LR-LR, N (%) N=1,300 (67.9%)
LR-HR, N (%) N=317 (16.6%)
LR-HR-AML, N (%) N=124 (6.5%)
LR-AML, N (%) N=173 (9%)
P
Age in years, median (range)
70 (18-94)
68 (19-91)
69 (18-86)
70 (33-97)
0.484
Gender Male
Female
801 (61.6) 499 (38.4)
207 (65.3) 110 (34.7)
97 (78.2) 27 (21.8)
123 (71.1) 50 (28.9)
<0.0001
Race White
Black Hispanic Others
1,181 (90.9) 24 (1.8) 44 (3.4) 51 (3.9)
298 (94) 6 (1.9) 4 (1.3) 9 (2.8)
116 (93.5) 2 (1.6) 4 (3.2) 2 (1.6)
159 (91.9) 7 (4)
2 (1.2)
2 (1.2)
0.373
Lab values, mean (range) WBC x109/L
ANC x109/L
Hb g/dL
Platelets x109/L
5.7 (0.3-175.2) 3.3 (0.09-152.4) 10.1 (2.9-17.1) 216 (3-1,450)
7.5 (1.1-400) 4.7 (0.17-240) 10.3 (3.6-16.7) 197 (17-1,251)
4.9 (1.4-28.7) 2.4 (0.27-34) 10.8 (5.9-16.7) 162 (9-969)
5.3 (1-47.2) 2.9 (0.09-240) 10.8 (6.6-18.1) 180 (9-1,644)
0.076
0.043 <0.001 0.001
BM blasts %, mean (range)
1.7 (0-10)
2.1 (0-8)
2.4 (0-7)
2.7 (0-16)
<0.001
Ferritin >1,000 mcg/L Yes
No
387 (32.3) 810 (67.7)
145 (49.8) 146 (50.2)
53 (46.5) 61 (53.5)
72 (52.2) 66 (47.8)
<0.0001
Albumin <3.5 g/dL 3.5-4 g/dL >4 g/dL
119 (9.3) 352 (27.4) 814 (63.3)
18 (5.8) 99 (31.6) 196 (62.6)
13 (10.7) 33 (27.3) 75 (62)
27 (15.8) 52 (30.4) 92 (53.8)
<0.012
t-MDS
204 (15.7)
40 (12.6)
12 (9.7)
22 (12.7)
0.161
WHO 2016 Classification MDS-SLD
MDS-MLD MDS-RS-SLD MDS-RS-MLD MDS-EB1
MDS-EB2 MDS-U MDS/MPN del5q MDS/MPN-RS-T
224 (17.2) 420 (32.3) 208 (16) 153 (11.8) 36 (2.8) 5 (0.4) 44 (3.4) 71 (5.5) 80 (6.2) 59 (4.5)
53 (16.7) 119 (37.5) 28 (8.8) 32 (10.1) 14 (4.4) 0
8 (2.5) 19 (6) 35 (11) 9 (2.8)
11 (8.9) 71 (57.3) 7 (5.6) 6 (4.8) 8 (6.5) 0
3 (2.4) 5 (4) 12 (9.7) 1 (0.8)
25 (14.5) 63 (36.6) 12 (7) 14 (8.1) 19 (11) 4 (2.3) 5 (2.9) 16 (9.3) 10 (5.8) 3 (1.7)
<0.0001
BM fibrosis grade 0 (N=1,000)
1 (N=327)
2 (N=158)
3 (N=49)
660 (66) 245 (74.9) 114 (72.1) 28 (57.1)
178 (17.8) 47 (14.4) 27 (17.1) 10 (20.4)
77 (7.7) 11 (3.4) 7 (4.4) 2 (4.1)
85 (8.5) 24 (7.3) 10 (6.3) 9 (18.4)
0.009
Haematologica | 109 July 2024
2159
Continued on following page.
