
Page 137 - Haematologica Vol. 109 - July 2024
P. 137
ARTICLE - Ppm1b regulates HSC homeostasis
Z. Lu et al.
deficiency, we performed RNA sequencing analysis with purified lineage negative cells from Ppm1bCKO and the cor- responding mice (Online Supplementary Figure S5A). En- riched gene sets were notably related to B-cell activation and immunoglobulin production (Online Supplementary Figure S5B). Given that transcription factors are crucial in controlling B-cell development,37 we next examined the ex- pression of the multiple transcriptional regulators in B220+ BM cells. Compared to B220+ cells from the corresponding mice, Ppm1bCKO B cells showed significant downregulation of these transcription factors (Online Supplementary Figure S5C), in which flow cytometry further confirmed Forkhead Box O1 (FOXO1) protein levels to be reduced (Online Sup- plementary Figure S5D).
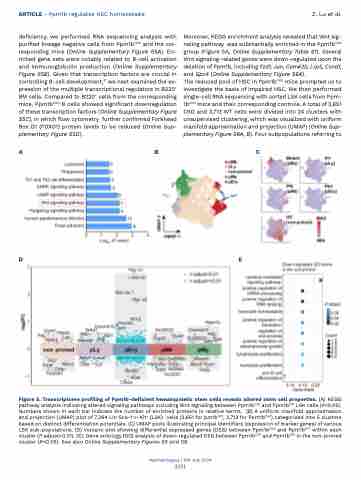
Moreover, KEGG enrichment analysis revealed that Wnt sig- naling pathway was substantially enriched in the Ppm1bCKO group (Figure 5A, Online Supplementary Table S1). Several Wnt signaling-related genes were down-regulated upon the deletion of Ppm1b, including Fzd1, Jun, Camk2b, Lrp5, Ccnd1, and Gpc4 (Online Supplementary Figure S6A).
The reduced pool of HSC in Ppm1bCKO mice prompted us to investigate the basis of impaired HSC. We then performed single-cell RNA sequencing with sorted LSK cells from Ppm- 1bCKO mice and their corresponding controls. A total of 3,651 CKO and 3,713 WT cells were divided into 24 clusters with unsupervised clustering, which was visualized with uniform manifold approximation and projection (UMAP) (Online Sup- plementary Figure S6A, B). Four subpopulations referring to
ABC
DE
Figure 5. Transcriptome profiling of Ppm1b-deficient hematopoietic stem cells reveals altered stem cell properties. (A) KEGG pathway analysis indicating altered signaling pathways including Wnt signaling between Ppm1bCKO and Ppm1bfl/fl LSK cells (P<0.05). Numbers shown in each bar indicate the number of enriched proteins in relative terms. (B) A uniform manifold approximation and projection (UMAP) plot of 7,364 Lin−Sca-1+c-Kit+ (LSK) cells (3,651 for pm1bfl/fl, 3,713 for Ppm1bCKO) categorized into 5 clusters based on distinct differentiation potentials. (C) UMAP plots illustrating principal identifiers (expression of marker genes) of various LSK sub-populations. (D) Volcano plot showing differential expressed genes (DEG) between Ppm1bCKO and Ppm1bfl/fl within each cluster (P.adjust<0.01). (E). Gene ontology (GO) analysis of down-regulated DEG between Ppm1bCKO and Ppm1bfl/fl in the non-primed cluster (P<0.05). See also Online Supplementary Figures S5 and S6.
Haematologica | 109 July 2024
2151
