
Page 135 - Haematologica Vol. 109 - July 2024
P. 135
ARTICLE - Ppm1b regulates HSC homeostasis
4A). Compared to control group mice, HN252 treatment led
to a greater decrease and subsequently slower recovery of WBC and lymphocytes but not PLT and RBC in PB (Figure 4B, Online Supplementary Figure S4A). HN252-treated mice
Z. Lu et al.
showed markedly reduced B220+ cells in PB and BM after 12 days of 5-FU injection when the blood cells had com- pletely recovered in control mice (Figure 4C, D). Moreover, it is notable that the proportion of LSK cells was also
AB
C
DEF
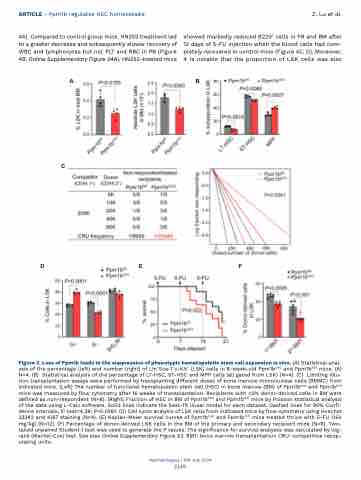
Figure 3. Loss of Ppm1b leads to the suppression of phenotypic hematopoietic stem cell expansion in vivo. (A) Statistical anal- ysis of the percentage (left) and number (right) of Lin−Sca-1+c-Kit+ (LSK) cells in 8-week-old Ppm1bCKO and Ppm1bfl/fl mice. (A) N=4. (B) Statistical analysis of the percentage of LT-HSC, ST-HSC and MPP cells (all gated from LSK) (N=4). (C) Limiting dilu- tion transplantation assays were performed by transplanting different doses of bone marrow mononuclear cells (BMMC) from indicated mice. (Left) The number of functional hematopoietic stem cell (HSC) in bone marrow (BM) of Ppm1bCKO and Ppm1bfl/fl mice was measured by flow cytometry after 16 weeks of transplantation. Recipients with <2% donor-derived cells in BM were defined as non-respondent (N=8). (Right) Fraction of HSC in BM of Ppm1bCKO and Ppm1bfl/fl mice by Poisson statistical analysis of the data using L-Calc software. Solid lines indicate the best-fit linear model for each dataset. Dashed lines for 95% Confi- dence Intervals; χ2 test=4.39; P=0.0361. (D) Cell cycle analysis of LSK cells from indicated mice by flow cytometry using Hoechst 33342 and Ki67 staining (N=4). (E) Kaplan-Meier survival curves of Ppm1bCKO and Ppm1bfl/fl mice treated thrice with 5-FU (150 mg/kg) (N=12). (F) Percentage of donor-derived LSK cells in the BM of the primary and secondary recipient mice (N=6). Two- tailed unpaired Student t test was used to generate the P values. The significance for survival analyses was calculated by log- rank (Mantel-Cox) test. See also Online Supplementary Figure S3. BMT: bone marrow transplantation; CRU: competitive repop- ulating units.
Haematologica | 109 July 2024
2149
