
Page 139 - Haematologica Vol. 109 - July 2024
P. 139
ARTICLE - Ppm1b regulates HSC homeostasis
activation of Wnt/b-catenin signaling led to the enhanced
proliferation and repopulation of HSC via overexpression of active b-catenin.49 In line with this finding, Kincade et al. also confirmed that constitutively active b-catenin ac- celerates the expansion of HSPC in vitro.50 However, other research groups demonstrated that constitutive activation of b-catenin inhibited the repopulation and differentiation of HSC by using transgenic mice.51,52 These inconsistent re-
AB
Z. Lu et al.
sults indicated that the role of Wnt/b-catenin signaling in HSC fate decisions is dependent on its degree. Our finding underscored the essential roles of Wnt/b-catenin signaling in HSC homeostasis. Loss of Ppm1b led to the decrease in active b-catenin (non-phosphorylated state) and its target genes’ expression in HSC, resulting in a blockage of self-re- newal in Ppm1b-deficient HSC. This was efficiently reversed by activating Wnt signaling (Figure 7).
C
D
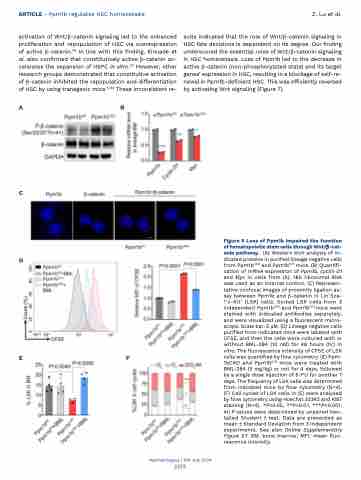
Figure 6 Loss of Ppm1b impaired the function of hematopoietic stem cells through Wnt/b-cat- enin pathway. (A) Western blot analysis of in- dicated proteins in purified lineage negative cells from Ppm1bCKO and Ppm1bfl/fl mice. (B) Quantifi- cation of mRNA expression of Ppm1b, cyclin D1 and Myc in cells from (A). 18S ribosomal RNA was used as an internal control. (C) Represen- tative confocal images of proximity ligation as- say between Ppm1b and b-catenin in Lin−Sca- 1+c-Kit+ (LSK) cells. Sorted LSK cells from 3 independent Ppm1bCKO and Ppm1bfl/fl mice were stained with indicated antibodies separately, and were visualized using a fluorescent micro- scope. Scale bar: 5 μM. (D) Lineage negative cells purified from indicated mice were labeled with CFSE, and then the cells were cultured with or without BML-284 (10 nM) for 48 hours (hr) in vitro. The fluorescence intensity of CFSE of LSK cells was quantified by flow cytometry. (E) Ppm- 1bCKO and Ppm1bfl/fl mice were treated with BML-284 (5 mg/kg) or not for 4 days, followed by a single dose injection of 5-FU for another 7 days. The frequency of LSK cells was determined from indicated mice by flow cytometry (N=4). (F) Cell cycles of LSK cells in (E) were analyzed by flow cytometry using Hoechst 33342 and Ki67 staining (N=4). *P<0.05, **P<0.01, ***P<0.001. All P values were determined by unpaired two- tailed Student t test. Data are presented as mean ± Standard Deviation from 3 independent experiments. See also Online Supplementary Figure S7. BM: bone marrow; MFI: mean fluo- rescence intensity.
EF
Haematologica | 109 July 2024
2153
